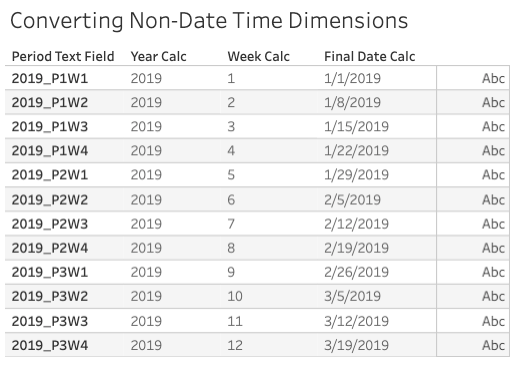
Date functions are some of the most powerful Tableau features, but what happens when you have a time-based dimension that’s not in a standard date format? I recently encountered this challenge with a client project. They had campaign data aggregated on a weekly basis, but grouped into periods rather than months. The overall schedule was thirteen four-week periods stored in a dimension field called “Period” similar to this example:
This weekly schedule also dictated the client’s dashboard needs. The client wanted to see the most recent week or the last 10 number of weeks in the charts. Since Period is a string field, we cannot use Tableau’s “Previous Week” filter function that works on date fields. We also can’t use a MAX function since it’s not a number. In this post, I will show you how to use this field to display the latest week and also how to convert it into a date.
Method 1: Using the LAST Function to show the last N weeks
Table calculations to the rescue! If we have the Period field in the view, we use the LAST function to create a filter and specify how many rows away from the last value we want to show. This works great for a trend chart that displays the last 10 periods. We can also use a parameter here to dynamically adjust the number of rows to show.
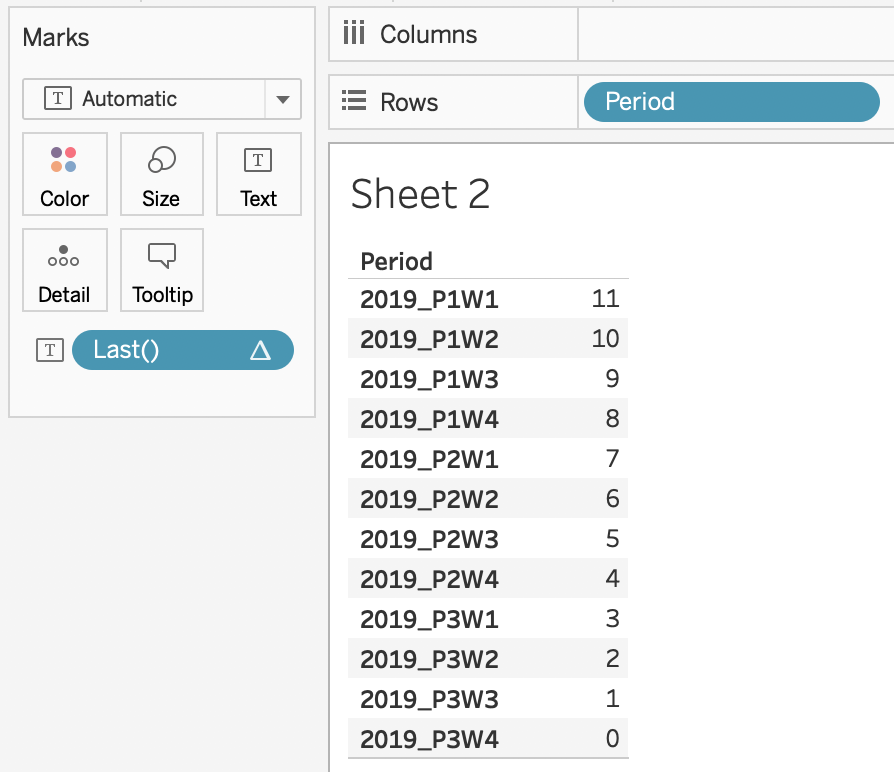
To demonstrate how the LAST function works, we create a calculated field that is simply LAST() and drag it onto the view along with the Period field. We see the value returned for each row is that row’s position away from the last row, with an index starting at 0.
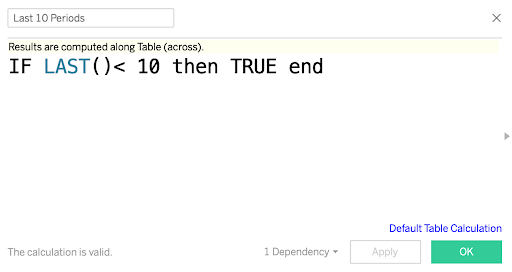
If we want to show the last 10 periods, we create a simple boolean filter calculation, drag it onto the filter shelf, and select to show only TRUE values. We will use < 10 (not ≤) because the index starts at 0.
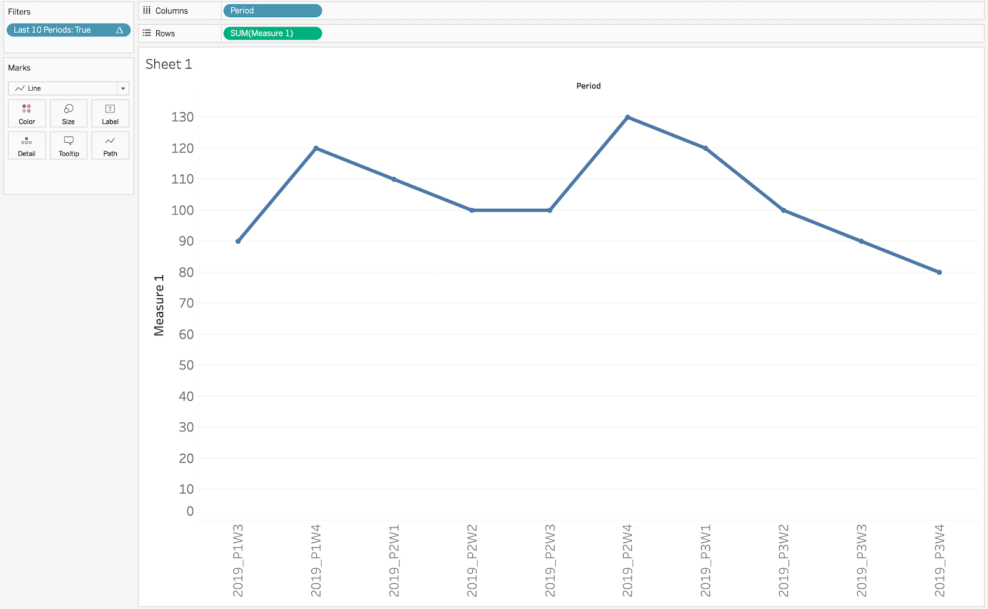
Once we enable the filter, the view is limited to the last 10 periods.
This method works in this situation because the data is appended each week and Tableau’s default sort is ‘Data Source Order, so the latest period is always at the bottom of the dataset. If your data is not structured this way however, you need to apply alphabetic sorting for this method to work.
Method 2: Converting a dimension to a Date Format
The next challenge is displaying only the last week’s data without the period dimension in the view. There are a couple ways to do this, but the most versatile is converting the period into a date format.
Since we have the year, period and week in the Period dimension, we can write a few calculations to give us the week number of the year and then approximate a date. It doesn’t have to be exact for our purposes.
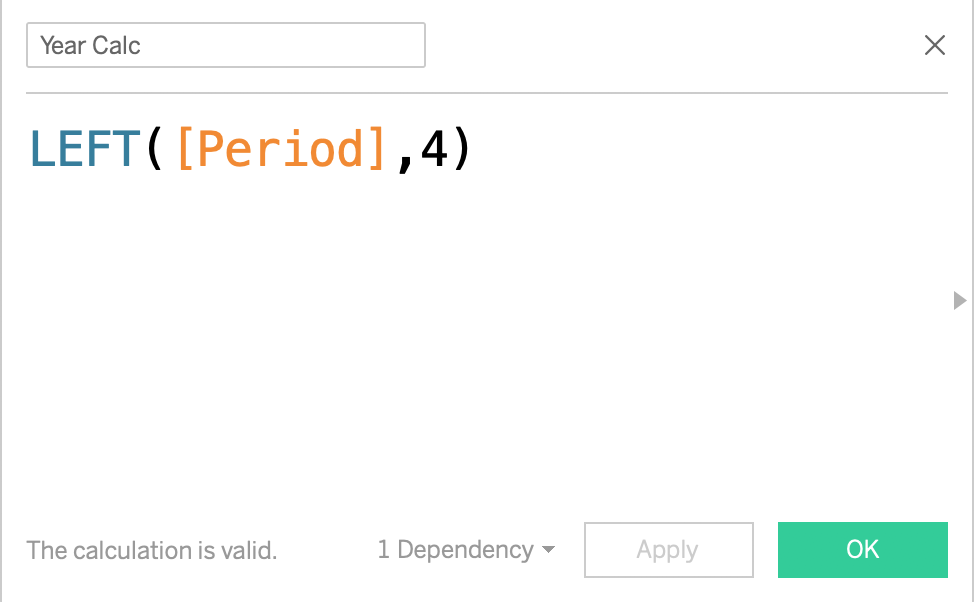
You could nest all your calculations into one, but I prefer to simplify and use separate fields. First, we need to grab the year from each period. This one is pretty straightforward, and we can use the LEFT function to grab what we need since the year is at the beginning of each string.
Next, we need to extract the week number. This one’s a little more complicated since it is dictated by the period and by the week. Since the strings are two lengths (when the periods get to 10 and up), we can write a simple IF statement to evaluate the length, retrieve the period and week number, and then perform some math to calculate the correct week number of the year.
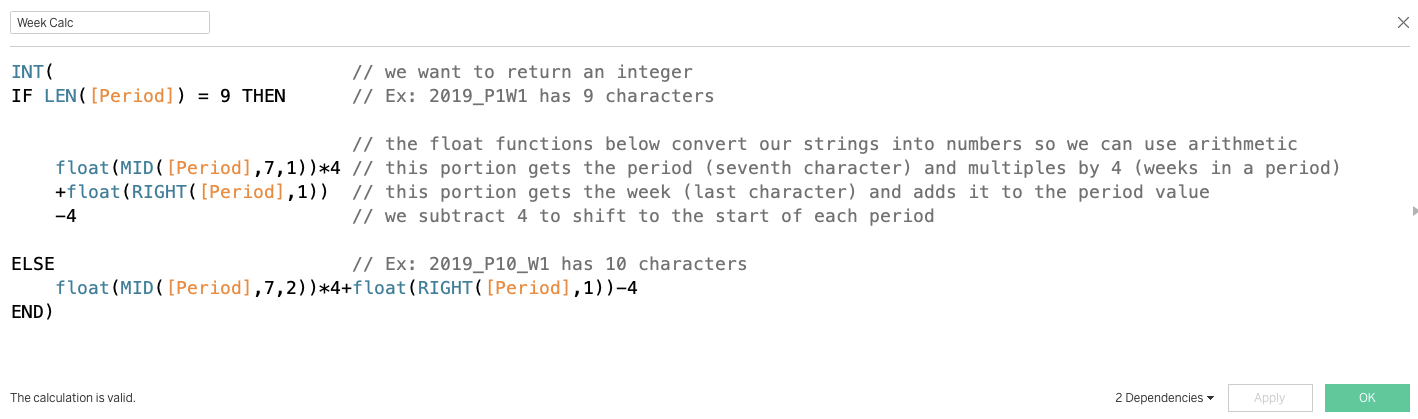
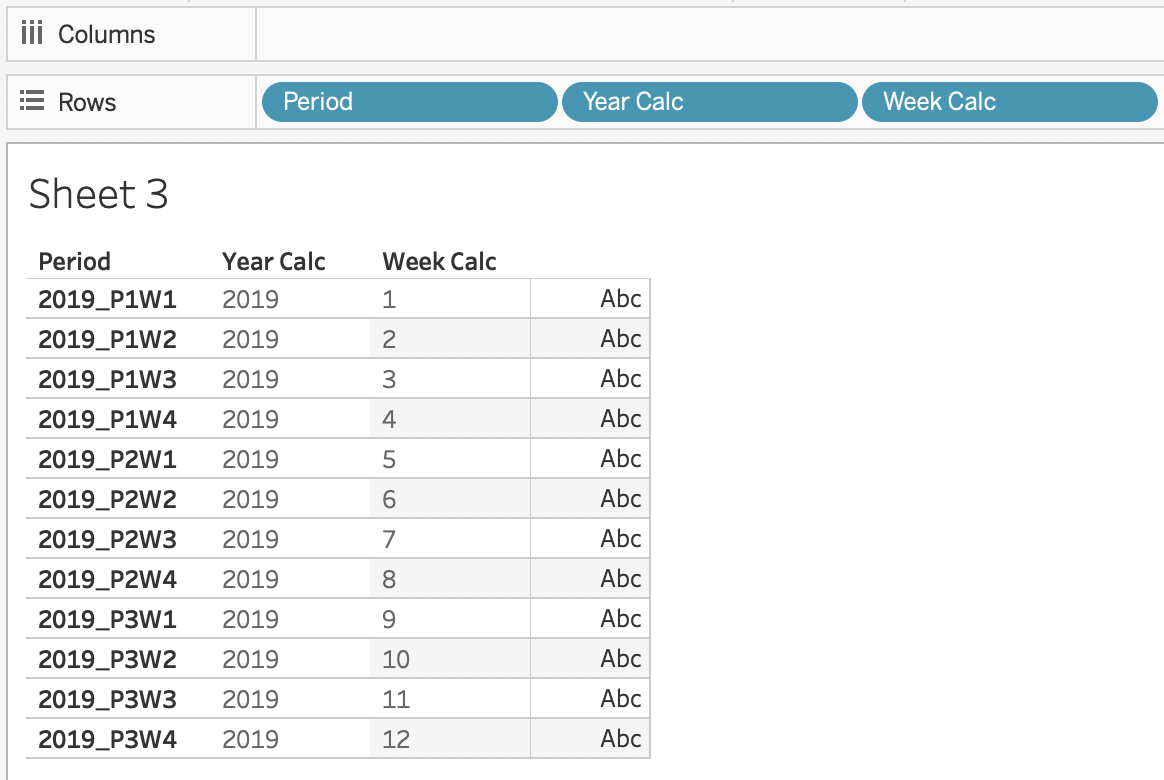
This calculation determines the string length, retrieves the period value, multiplies it by four, then adds it to the week value, while also subtracting four from the final value. We can see this in action by putting the fields in a table to make sure it’s working.
Now that we have the week, we could use a MAX function to display the latest week, but would have to do some more work to get that to work across years. Another option is to take it one more step and convert the year and week into a date so we can use the “Previous Week” function to always show the latest period.
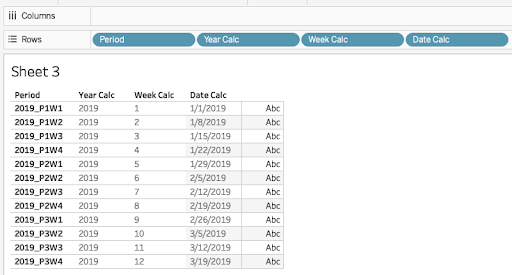
To convert to a date, we can combine the DATEADD and DATE functions.

This calculation creates a start date of 1/1 for each year in the data set and then adds the appropriate week number to it (minus 1). We now have a date that corresponds with each period in our data set! The day of the week that 1/1 falls on doesn’t matter in this scenario. All we care about is assigning a period and week to the corresponding week of the year.
From here we can use built-in Tableau date filter functions to show the data we want. Click this link to download the workbook tutorial for reference. I encourage you to download, check out the calculated Date fields, and repurpose to solve your own challenges related to non-date time dimensions. Remember that if there’s a will, there’s usually a way to do it in Tableau.
Written By

Jay Farias
Data Visualization Manager Jay Farias is a technology enthusiast who specializes in Tableau. He has years of experience implementing innovative technology solutions in the construction and healthcare industries. He supports Data Visualization strategy and implementation for Kantar Health and Intuit.