
Once you have chosen the best Tableau product for you, it is time to start finding insights in your data! Much like Tableau’s suite of products, data connections come in many shapes and sizes. As of this writing, Tableau Desktop: Personal has four different types of data connections, and Tableau Desktop: Professional adds another 48 native ways to connect to data. That doesn’t even count the ability to access web data through customized connectors or ODBC connections.
As you can imagine from the breadth of connection options, you can connect to almost any type of data in Tableau and if you don’t see the connection you are looking for, somebody is likely working on a customized solution that will help. We could write an entire book on the different data connections alone, but they all work similarly and are fairly intuitive. So for the purposes of this post, we will show you how to get started with one connection type and a few of the ways you can prepare to work with the data.
Connecting to Data in Tableau
In addition to the more than fifty types of data connections mentioned in the introduction, every download of Tableau comes with a sample dataset called Sample – Superstore. When you open Tableau, you will see a screen that looks like this, where you have the option to choose your data connection:
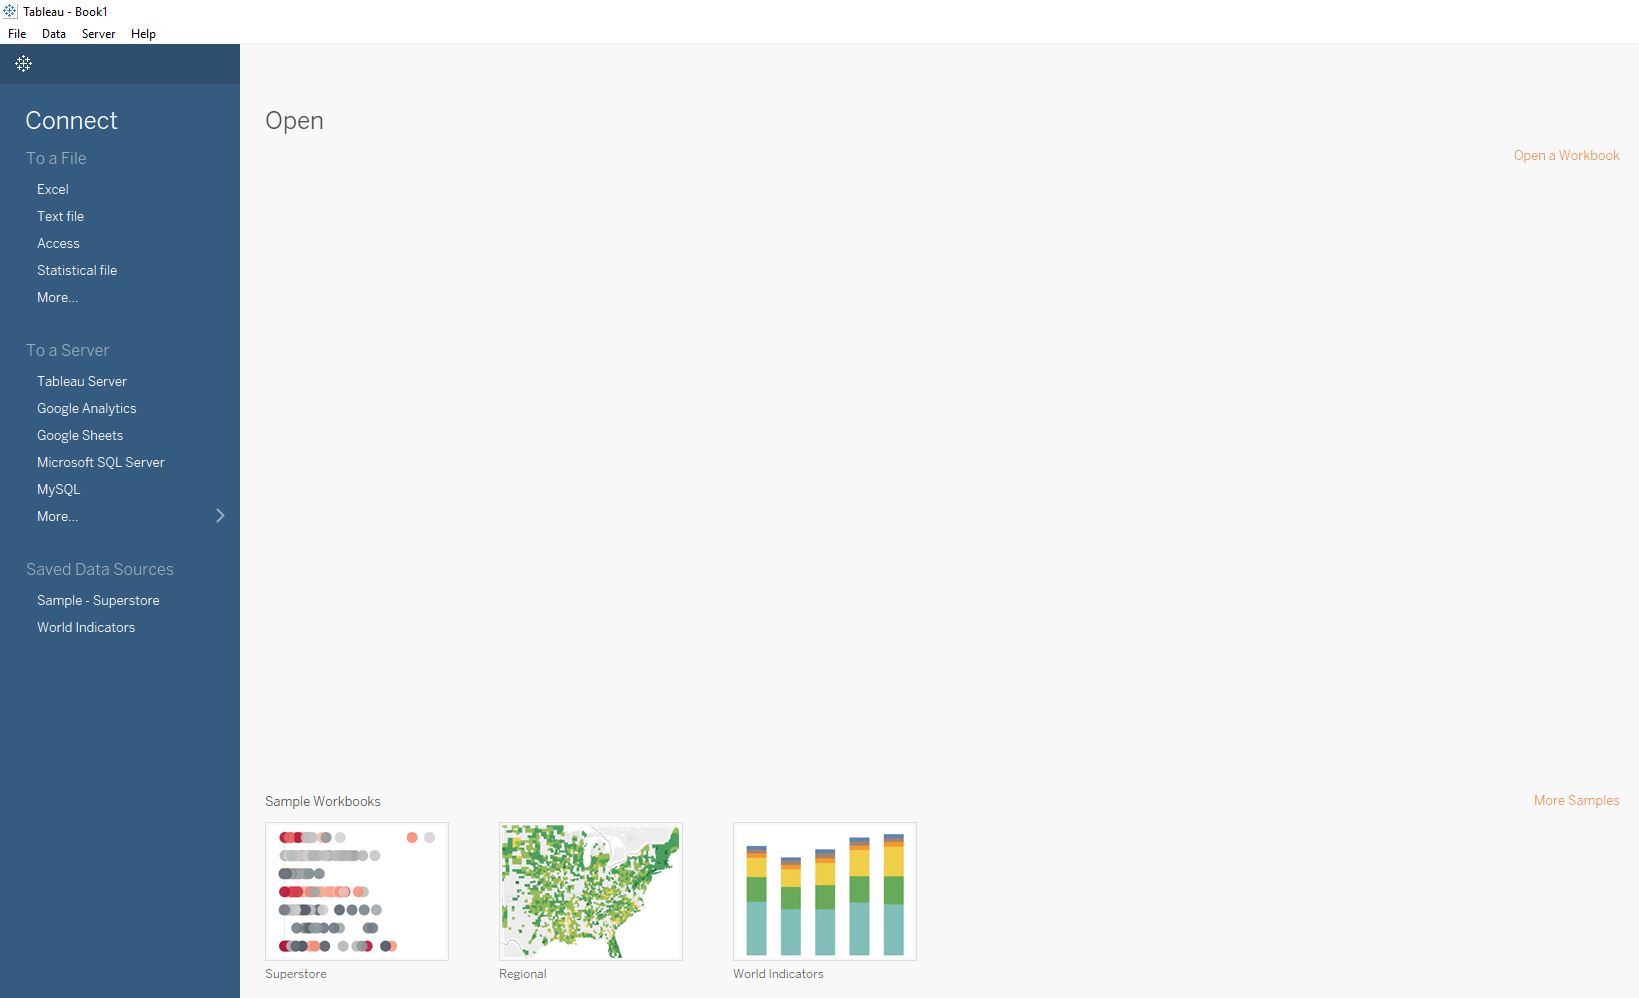
The options under the navigation heading “To a File” can be accessed with Tableau Desktop: Personal. All possible data connections, including to data that resides on a server, can be accessed with Tableau Desktop: Professional.
At the bottom of the left navigation, there are a couple of data sources that come with every download of Tableau. The first, Sample – Superstore, is actually an Excel file, so you can connect to it whether you are using Tableau Desktop: Personal or Tableau Desktop: Professional. We like to train with this data source because it is the most common data source used in online tutorials and during Tableau’s own training. To start using it, click on it.
After clicking on a saved data source, you are immediately thrown into the authoring interface. We discuss getting a lay of the land in another post, but we actually want to take a step back to show you what happens when you normally connect to a new data source. To get to the data editing interface, click “Data” in the top navigation, hover over the data source at the bottom of the dropdown, and click “Edit Data Source…”. You should be taken to a screen that looks like this:
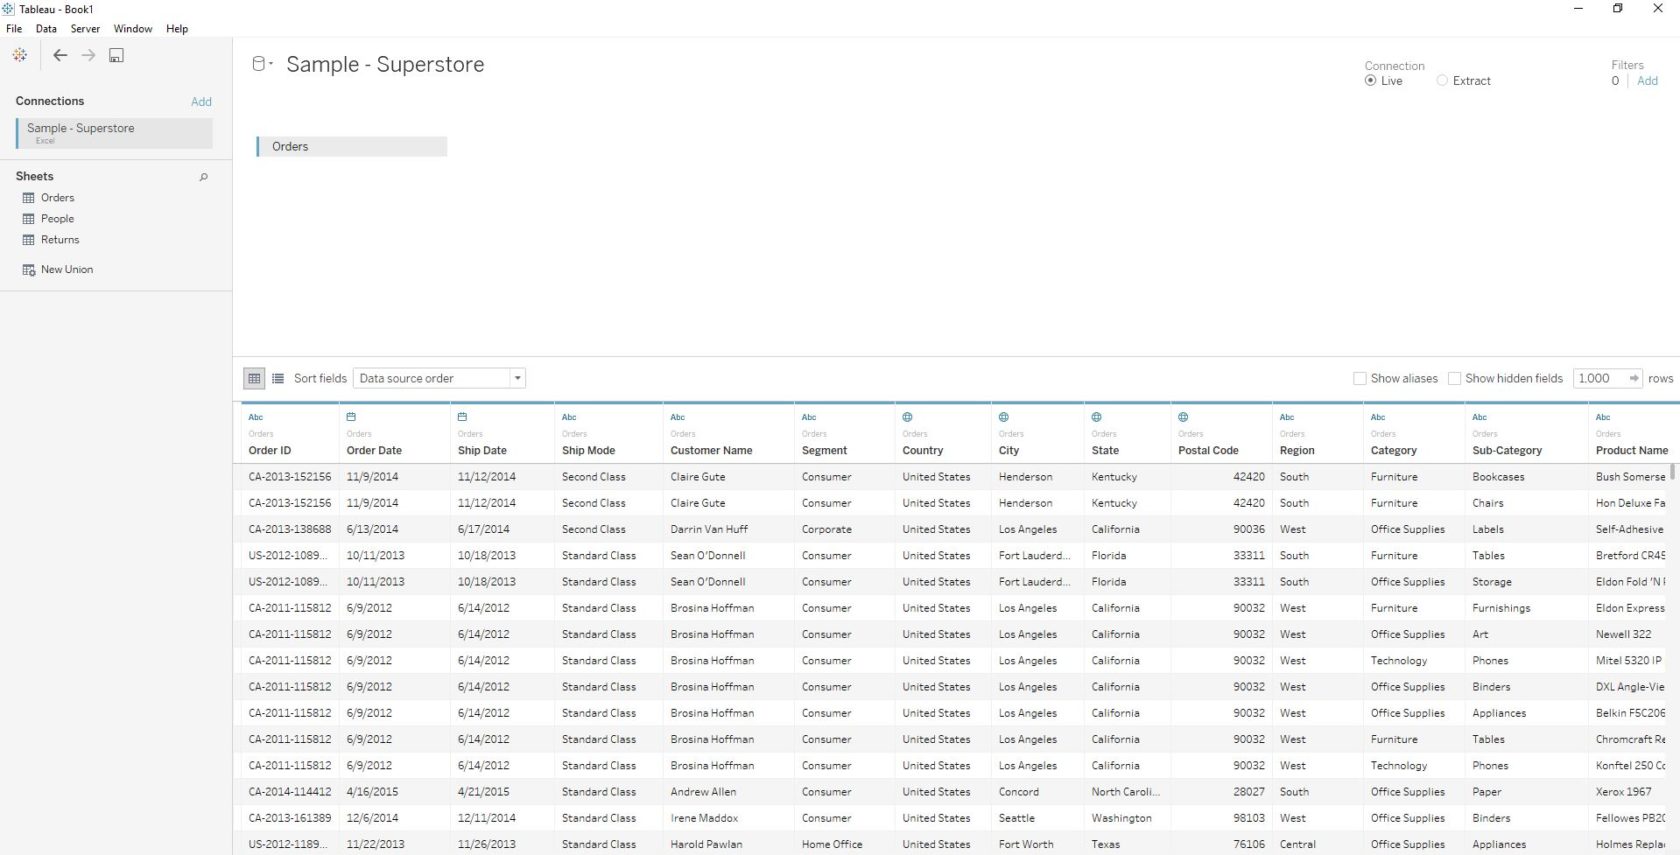
This is the screen you will be presented with when connecting to an Excel or database connection. In Tableau, the Excel workbook is treated as a database and the individual tabs are treated as individual tables within that database. For this reason, you can join tabs to each other if they have at least one field in common. To do so, simply drag the table (tab) that you want to join into the data editing interface and tell Tableau what the two tabs have in common. Here’s what the Sample – Superstore dataset looks like after we dragged the Returns table into the view and set up a left join on Order ID.
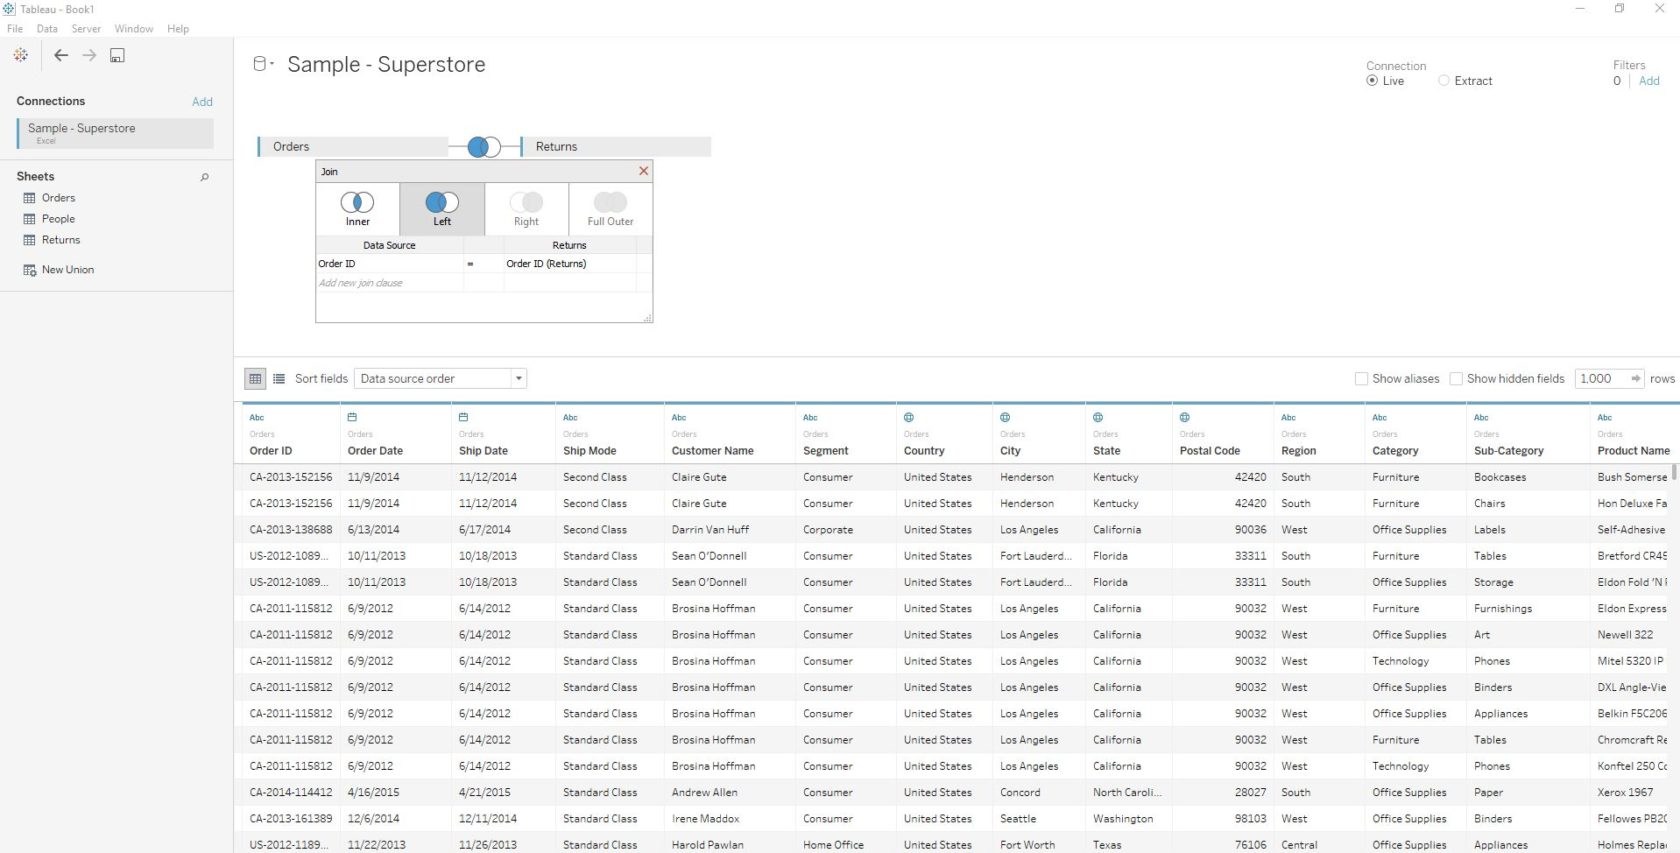
You can even do cross-database joins the data comes from different types of data connections. To do this, you would click “Add” to the right of “Connections”, connect to your additional data source, and set up a join just as pictured in the previous image.
If you’re working with multiple tables that all have the same column headers, it may make more sense to union, or stack, the tables instead of joining them. Maybe you’ve got twelve months of web analytics data in one Excel file, but each month’s data live on a separate tab. To union the twelve tabs, you would drag “New Union” from the left navigation onto the data editing interface, then drag the tables that you want to union into the box that appears. When you create a union in Tableau, a column will be added that tells you what sheet the data came from.
Preparing Columns
After you’ve retrieved the data you want work with, there are a few more options for preparing each column. To access them, click the down arrow next to the data type icon for each column:
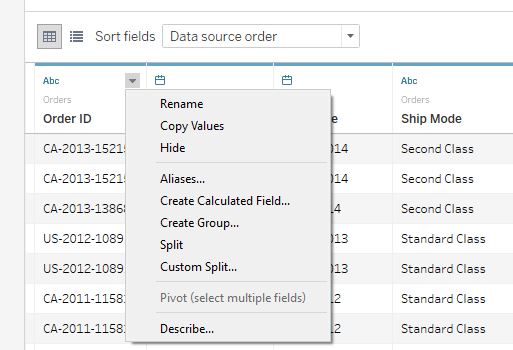
The options are:
Rename: Allows you to rename the field.
Copy Values: When nothing is selected, places the value in the first row on your clipboard (preselecting rows before choosing this option will copy your selection).
Hide: Hides the entire column.
Aliases…: Allows you to assign new names to individual dimension members.
Create Calculated Field…: Allows you to create a new field before you start using it within Tableau.
Create Group: Allows you to group different dimension members. This can be handy for quick data clean-up.
Split: Tableau will look at the dimension members in your column and guess the most appropriate way to split them into multiple columns.
Custom Split…: The same as split, but you determine how to separate the dimension members.
Pivot: When you have multiple columns selected, you can transpose them. Note you can only do one data pivot per data source.
Describe: Gives you additional information about the field.f
When going through this process for quantitative fields, the string functions are not available, and one additional option is available: “Create Bins…”. This creates equally-sized bins, which can be used to make histograms.
Lastly, you can also change the data type of a column by clicking the data type icon at the top of the column.
It’s important to note that any changes you make to the data at this point creates metadata and has no impact on your underlying data source. This means you can make rapid progress in Tableau without the risk of messing up your existing infrastructure.
Extracts & Data Source Filters
Another notable task that you may choose to do when connecting to a new data source is either extract or filter the data source. By default, most data source connections will be live with no filters; these options can be seen in the top right corner of the data editor:

Extracts create a snapshot of your data at whatever point they were created. They are typically faster than a live data connection, especially when connecting to a database, and are my general recommendation. Just remember that extracts have to be refreshed periodically so that you are working with the latest data possible.
The final option discussed in this post is the ability to filter the entire data source before you start working with it in Tableau. These filters can be created with any combination of fields by clicking the “Add” button under “Filters”. This is an easy opportunity to make your workbooks more efficient because you have the ability to filter out the data you don’t need for your analysis. For example, if your analysis is about this year’s data, don’t pull in the last ten years of data! Or maybe you are building the workbook for a stakeholder that is only responsible for one division and they’re not allowed to see the performance of other divisions. Adding a filter in this scenario not only makes the workbook process more efficiently, it will help you manage security to ensure data does not fall into the wrong hands.
With all of these choices, you should be able to set your data up exactly as you wish before you start working with it. However, if you are trying to transition existing Excel reports or working with irregularly shaped data, you may benefit from also reading Shaping Data for Use with Tableau.
Written By

Evolytics
This post is curated content from the Evolytics staff, bringing you the most interesting news in data and analysis from around the web. The Evolytics staff has proven experience and expertise in analytics strategy, tagging implementation, data engineering, and data visualization.