Am I really at a conference?
This thought persisted through former team member Rob Harrison’s mind, throughout the 2014 Tableau Conference. From the moment he entered the building, he could tell this was not a typical conference.
Our team picked up our bags off of an airport style conveyor belt and moved to the breakfast bar. There we enjoyed an espresso and heard the Jackson 5 from the morning DJ, who was spinning vinyl nearby. We ventured into the main conference room where music, fog, and club lights set the tone for the elaborate set built for the speaker. Projected onto this set were live curated tweets, and slow motion videos of people acting out their own hilarious scenes – complete with confetti, huge boxing gloves, and other props.
This conference also featured a night out in Seattle, where the Seattle Center was packed with Tableau users. The Experience Music Project, glass art, a Sir-Mix-A lot performance, and the Space Needle all rolled into one party. Aside from these entertaining aspects of the trip, there was also some real substance to the keynote speeches, as well as the breakout sessions.
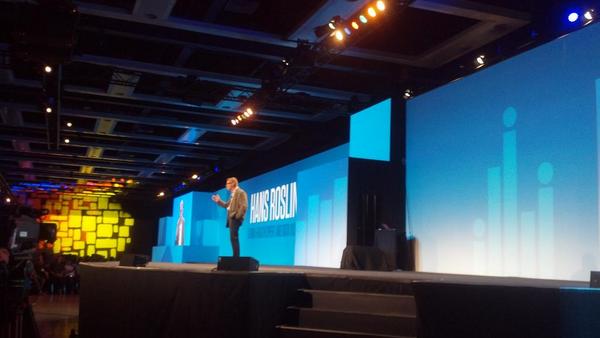
Hans Rosling @HansRosling on #data14 stage talking about global trends pic.twitter.com/wsFkYKBlNL
— Ramon Martinez (@HlthAnalysis) September 11, 2014

Thanks @tableau for Sir Mix a Lot at #data14 . Awesome!

Party set underneath the Space Needle #awesome #data14
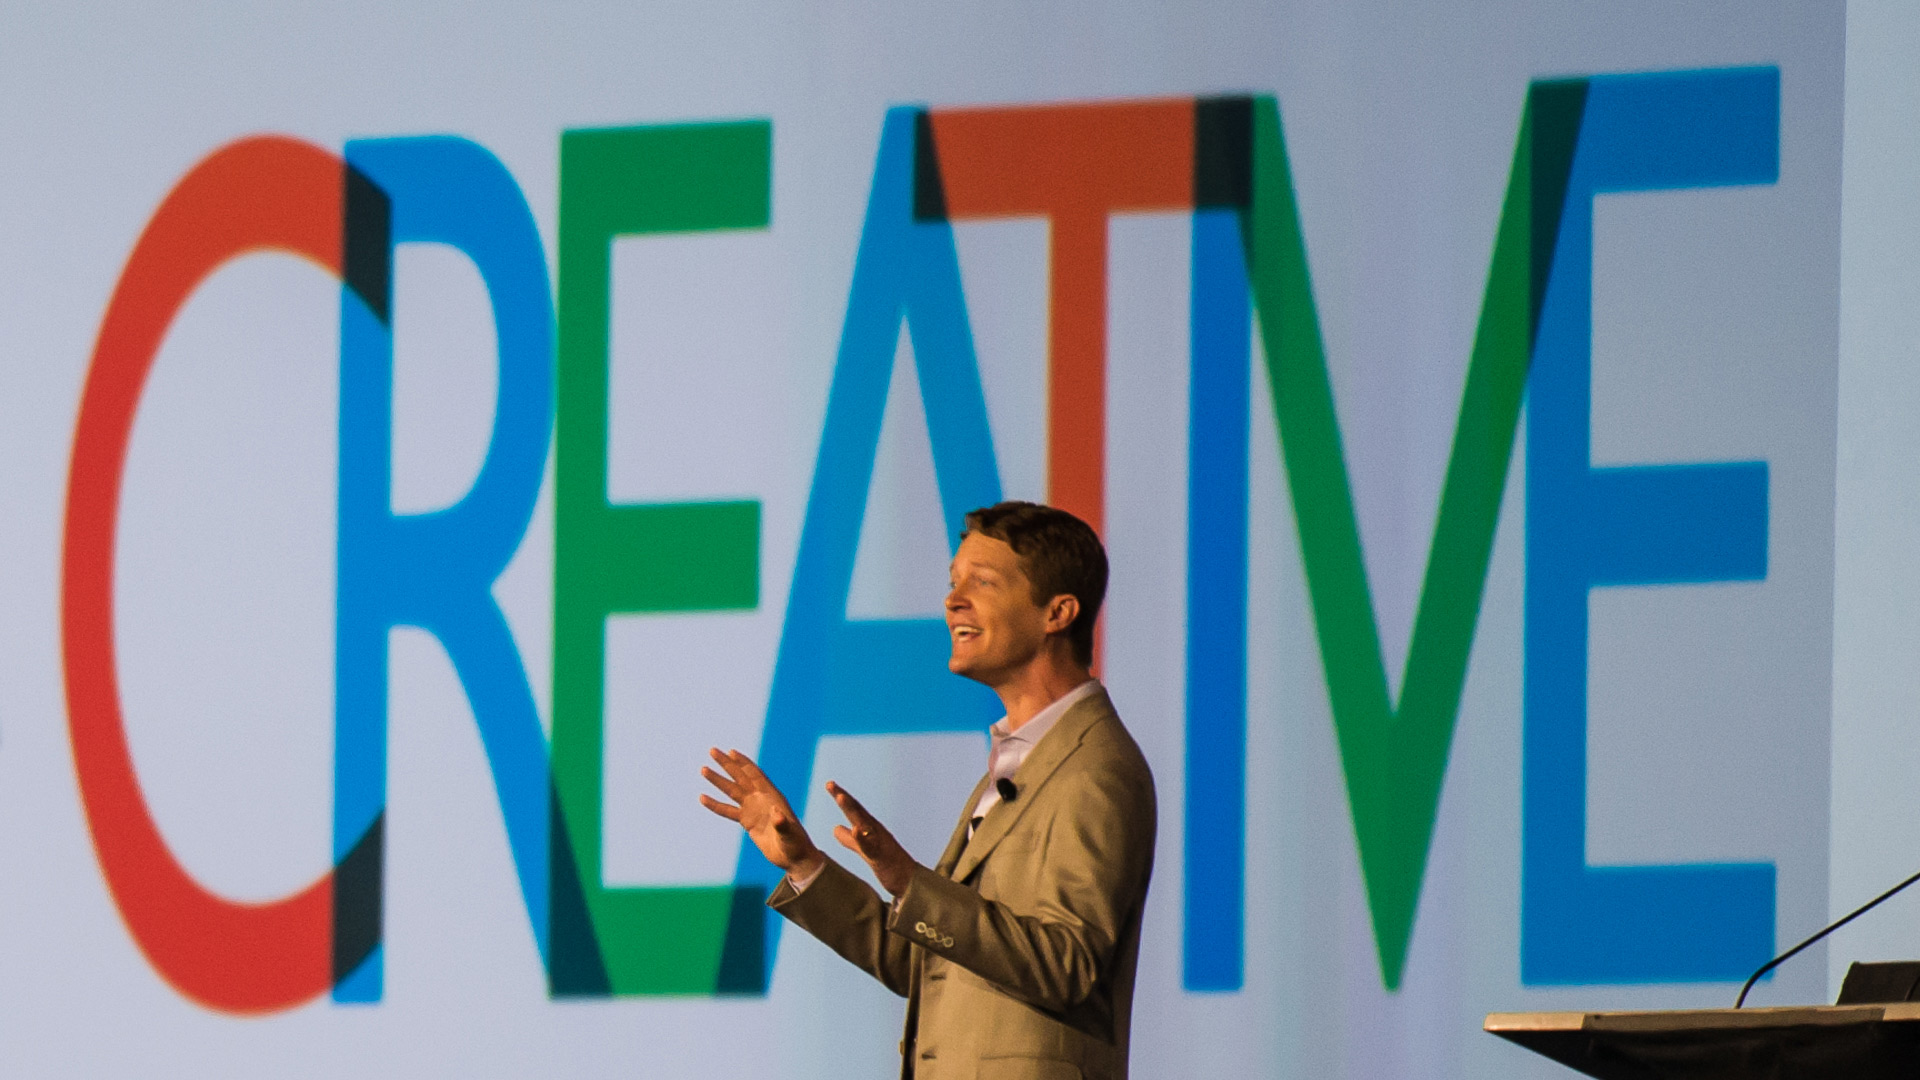
‘Data Artists’
Data visualization as a creative process is something we hold true here at Evolytics, and Rob was excited to hear Christian Chabot speak to this practice. “Analysts and artists are both on a mission to reveal something new — to discover truth, to find meaning.”
The more we learned about and worked with Tableau, the more we saw it as a tool for ‘data artists’.
Data gives us the context, and it’s up to us to craft a visualization that accurately portrays that data.
Rob attended “Making a Viz That Stops Traffic” with Paul Banoub, Anya A’Hearn, and Dan Montgomery as the speakers. They had some creative tips on keeping Data Viz content fresh as well as fun. They encouraged the audience to pick a subject that means something to them. It could be something newsworthy or scientific, but it could also be something a bit quirky or off the wall too.
Ultimately, creating an environment of discovery and excitement in a data visualization will leave your audience enlightened, rather than bored to death.
Storytelling Rooted in Data
At Evolytics, we believe that great storytelling begins with knowing your audience. Knowing your audience helps to determine what information is necessary, and ensures a clear message is being sent.
Micheal Lewis touched on knowing your audience, and offered some fundamental storytelling tips in his keynote. Don’t bog down your audience with the details, Lewis suggested we must “Eliminate all unnecessary information.” Also, sometimes it is best to keep it simple – “Imagine you are explaining it to your mother…give your audience the luxury of ignorance”.
In his keynote speech, Neil deGrasse Tyson said “Make a narrative that has the greatest impact, rooted in data.” Tyson also spoke about “objective observation” and its importance in data analysis. These are both exceptional mantras to live by when working in analytics. Taking on a receiver-orientation, looking at the data impartially, and letting the data lead your insights will yield a much clearer path to future success.
Geek is the new chic!! @neiltyson @tableau #data14 pic.twitter.com/mVYR9vAeoj
— Wendy Gradek (@WendyGradek) September 10, 2014
To Sum It Up…
The Tableau Conference wasn’t just a run-of-the-mill seminar, it was a gathering of the minds in data visualization. Our team enjoyed the vastly diverse backgrounds of the speakers and all of the people at this conference. Our beliefs behind the creative, analytical, and story-telling nature of data were bolstered, as well as, expanded upon.
The Tableau community impressed us with its welcoming nature and promotion of each member’s growth. There is a true appreciation for data visualization and the knowledge we all gain from each other.
More to come soon!
Written By

Evolytics
This post is curated content from the Evolytics staff, bringing you the most interesting news in data and analysis from around the web. The Evolytics staff has proven experience and expertise in analytics strategy, tagging implementation, data engineering, and data visualization.