A stacked area chart ‘stacks’ trends on top of each other to illustrate how a part-to-whole distribution is changing over time. When combined with a table calculation that computes the percent of total for each dimension member in the visualization, stacked area charts are an effective way to evaluate distributions.
To create a stacked area chart, we will start with this line graph showing Sales by Sub-Category by discrete month of Order Date in the Sample – Superstore dataset.

To create a stacked area chart in Tableau, simply change the mark type from Automatic, which is currently set to Line, to Area.

As stacked area charts on one of the foundational Show Me options and are extremely easy to create in Tableau, this post will focus more on the best applications of this chart type and a trick for using them most effectively.
As you can see in the previous image, when the mark type was changed from line to area, the values for each of the dimension members for Sub-Category were stacked on top of each other. This provided a new insight to us that was not available when the mark type was line: the monthly total across all 17 sub-categories. If it was more important to know the monthly total versus the exact contribution of each sub-category, the stacked area chart is the right tool for the job.
However, if it is more important to know the individual trends of each sub-category, that becomes difficult to assess with a stacked area chart. The reason is that after the trend on the bottom of the stack, each subsequent trend inherits the trend below it. So by the time you get to the slice on top, the value equals the value of the first 16 slices combined, plus the value of the 17th and final dimension member. You can turn off the stacks by navigating to Analysis > Stack Marks and choosing ‘Off’, but at that point, you’re better off with the line graph we started with.
One other big word of caution if you are using stacked area charts: never use them to stack rates, such as a click-through rate, open rate, or another type of conversion that divides a numerator by a denominator. This is again because the trends are stacked on top of each other, so if you have three dimension members, each with a conversion rate of 5%, the top slice would display the value of the first two stacks combined (10%) plus the value of the third and final dimension member (5%). In this scenario, the slice on top would display a value of 15%, far from its true 5% performance.
So when is a stacked area chart a good choice?
We like to use stacked area charts when the total axis equals 100% and each individual dimension member is displayed as a percentage of the total. This can be achieved by adding a quick table calculation for ‘Percent of total’ to the measure being displayed.
For a refresher on table calculations, see the post: An Introduction to Tableau Table Calculations.
By default, Tableau calculates table calculations across the table. So if we were to add a quick table calculation for percent of total to the stacked area chart in the previous image, we see this:
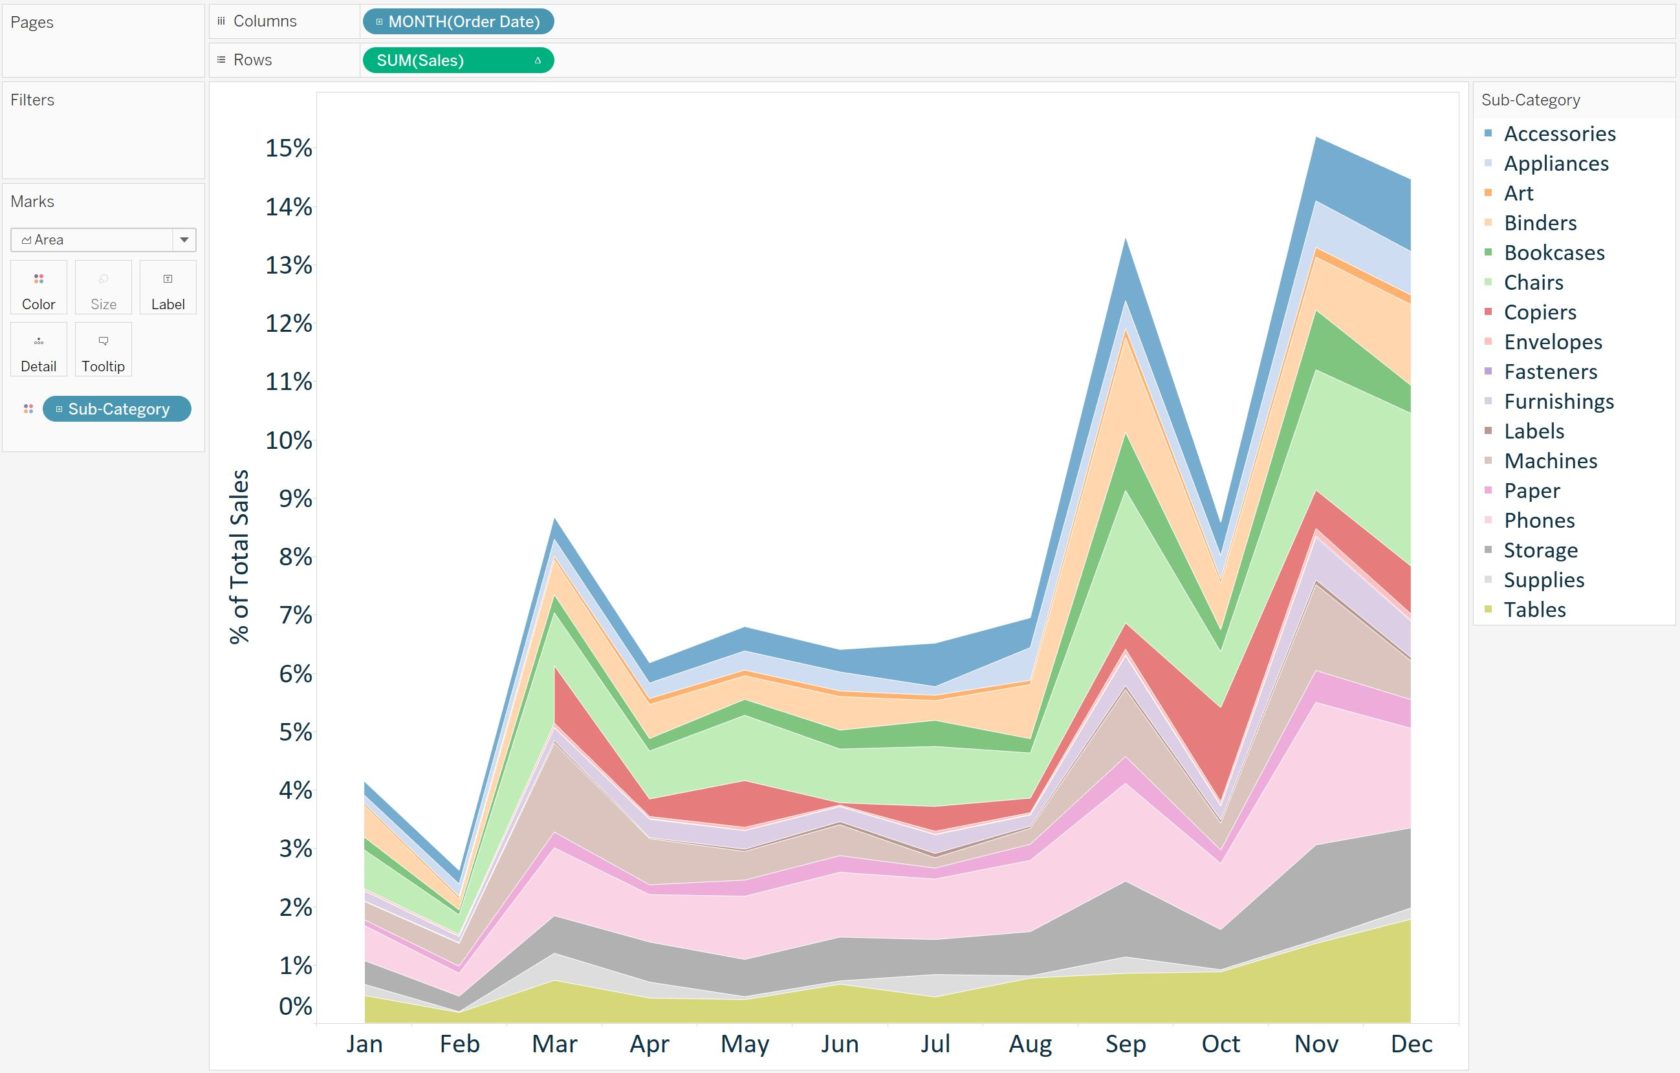
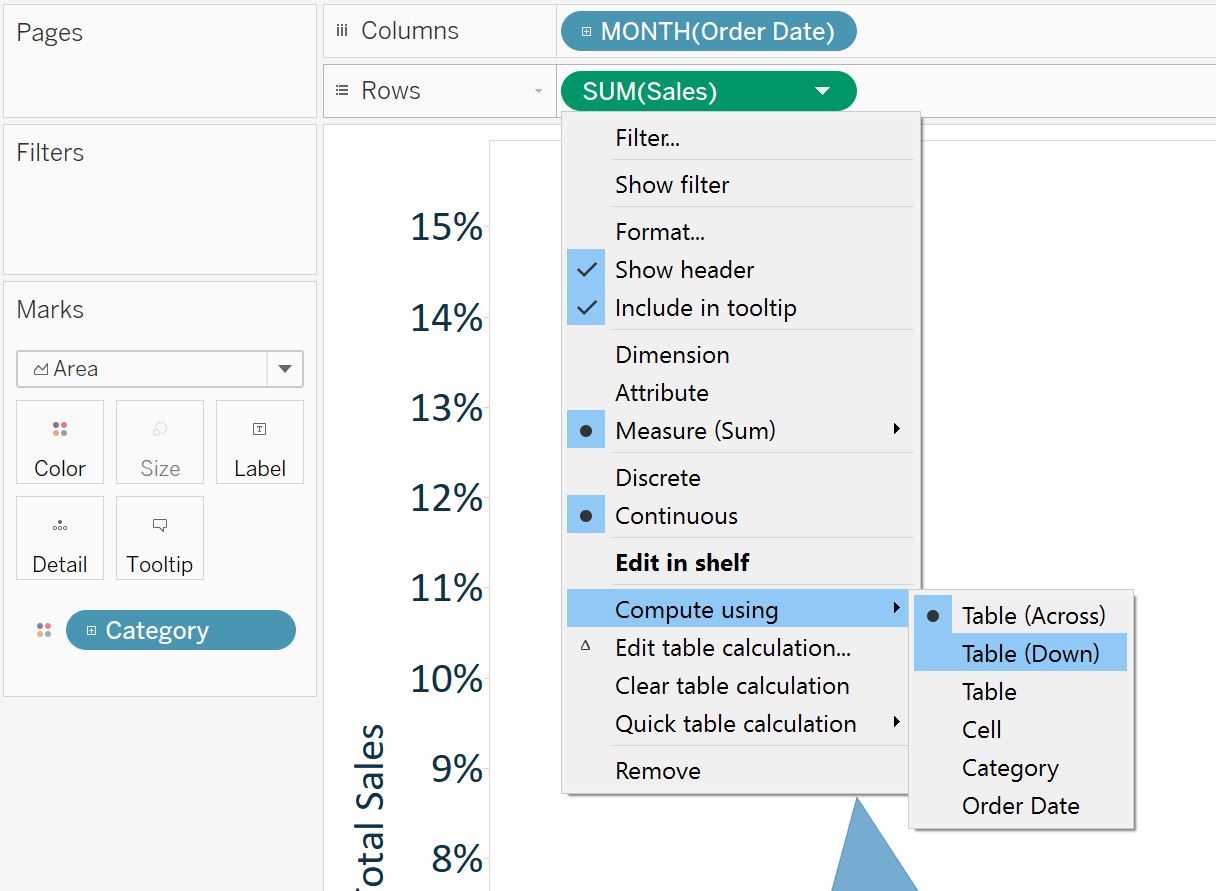
With this view, the trends look exactly the same, but the axis is being displayed as a percent of total instead of the raw revenue values. To change the view so that the axis totals 100% and the areas represent each dimension member’s contribution to each month’s total, the table calculation needs to be changed to compute using Table (Down). This is changed by clicking on the measure with the table calculation for percent of total, now designated with a delta symbol, hovering over ‘Compute using’, and choosing ‘Table (Down)’:
The view looks as follows after changing the direction of the table calculation, making it easier to see the monthly contribution for each individual dimension member:

Unless the slice is on the top or the bottom, it can still be challenging to evaluate the trends for individual dimension members with a great deal of precision. At the very least, it should be easier to evaluate which dimension members are gaining or losing share from month to month. As with most analyses in Tableau, the chart selection should be informed by the business question at hand. Stacked area charts, especially when combined with table calculations, are a good visualization to have in your toolbelt to display how distributions in your business are changing over time.
Written By

Evolytics
This post is curated content from the Evolytics staff, bringing you the most interesting news in data and analysis from around the web. The Evolytics staff has proven experience and expertise in analytics strategy, tagging implementation, data engineering, and data visualization.