In the last two posts, you’ve read how to make a symbol map with Mapbox maps and how to make a filled map in Tableau.
This post provides a step-by-step tutorial on how to combine the two into a single, dual-axis map.
The final view in this example will display sales by city as a symbol map and US States colored by region as a filled map:

This type of map is useful any time you want to combine two maps into one to help provide additional context that would not be available when showing only one map or the other.
One of the best real-life use cases we have seen for a dual-axis map in Tableau was when a partner wanted to see how the sales of their product by territory compared to the brick and mortar locations of a competitor.
Create the First Map
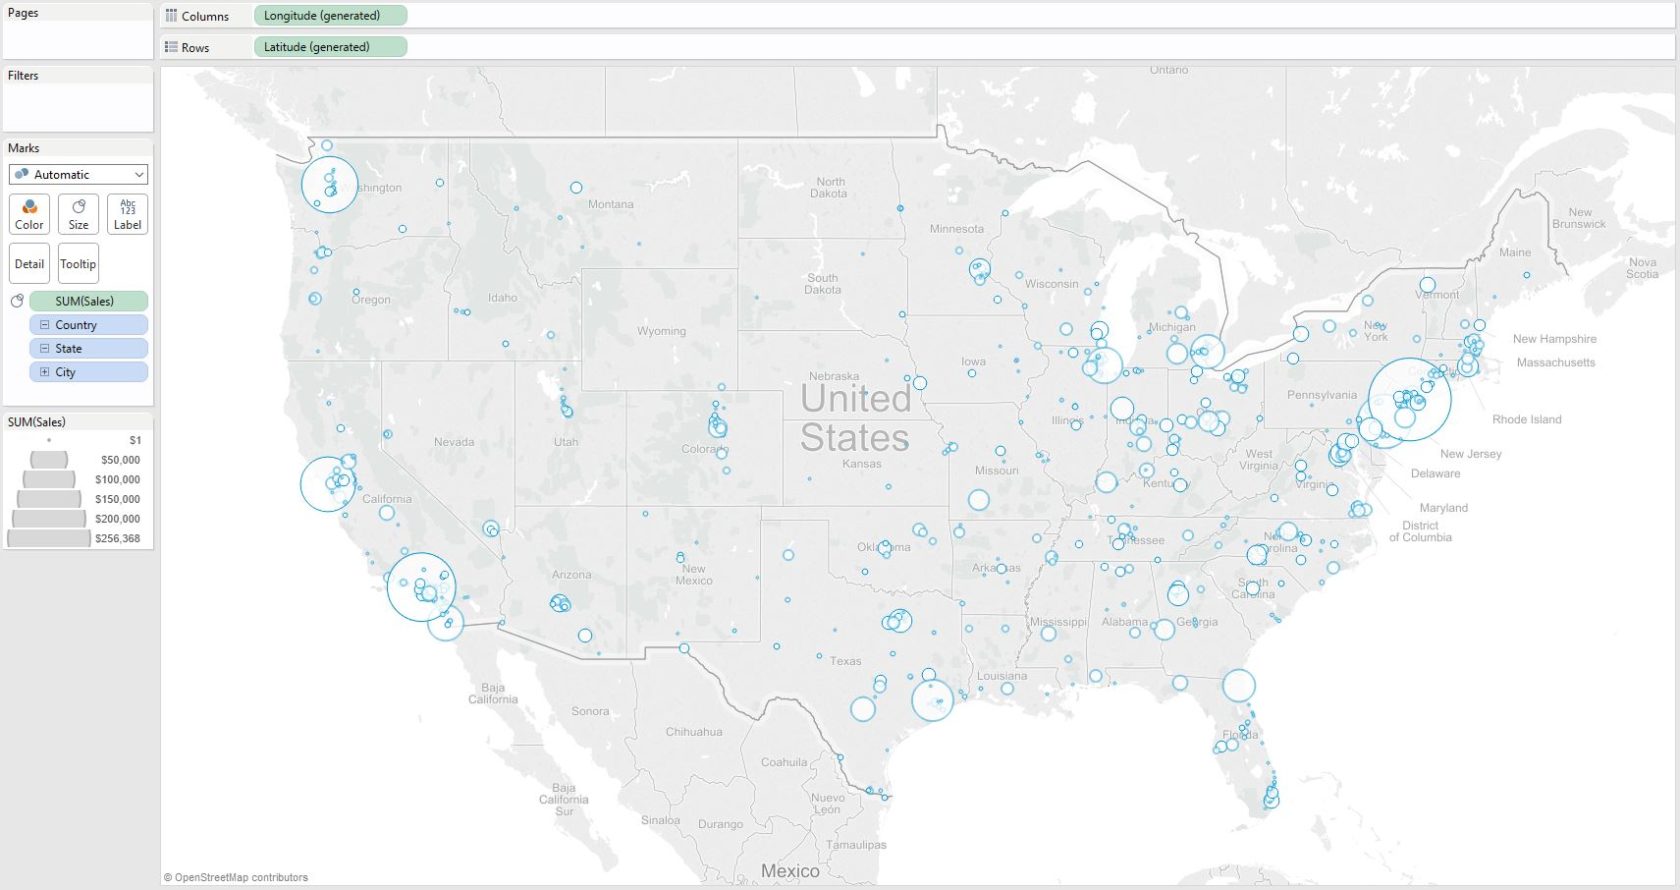
To create a dual-axis map in Tableau, start by creating one of the two maps that you want to combine. We will start this example by creating a symbol map for sales by city.
Duplicate to Create the Second Map
Once the first map is created, you can create a duplicate of that map in one of two ways:
- While holding the Control key, left click and drag the Longitude field on the Columns Shelf or the Latitude field on the Rows Shelf right next to itself. This is a shortcut for duplicating fields that works with any blue or green pill in Tableau.
- Drag Longitude from the Measures Shelf to the second position on the Columns Shelf or Latitude from the Measures Shelf to the second position on the Rows Shelf.
Multiple Marks Shelves
Whichever method you select, the key is that by placing a second pill on the Columns or Rows shelf, a second Marks Shelf is generated.
Now that there are two separate Marks Shelves, one for each map, the maps can be edited independently. That means a symbol map can exist on the first Marks Shelf, and the second Marks Shelf can be changed to a filled map
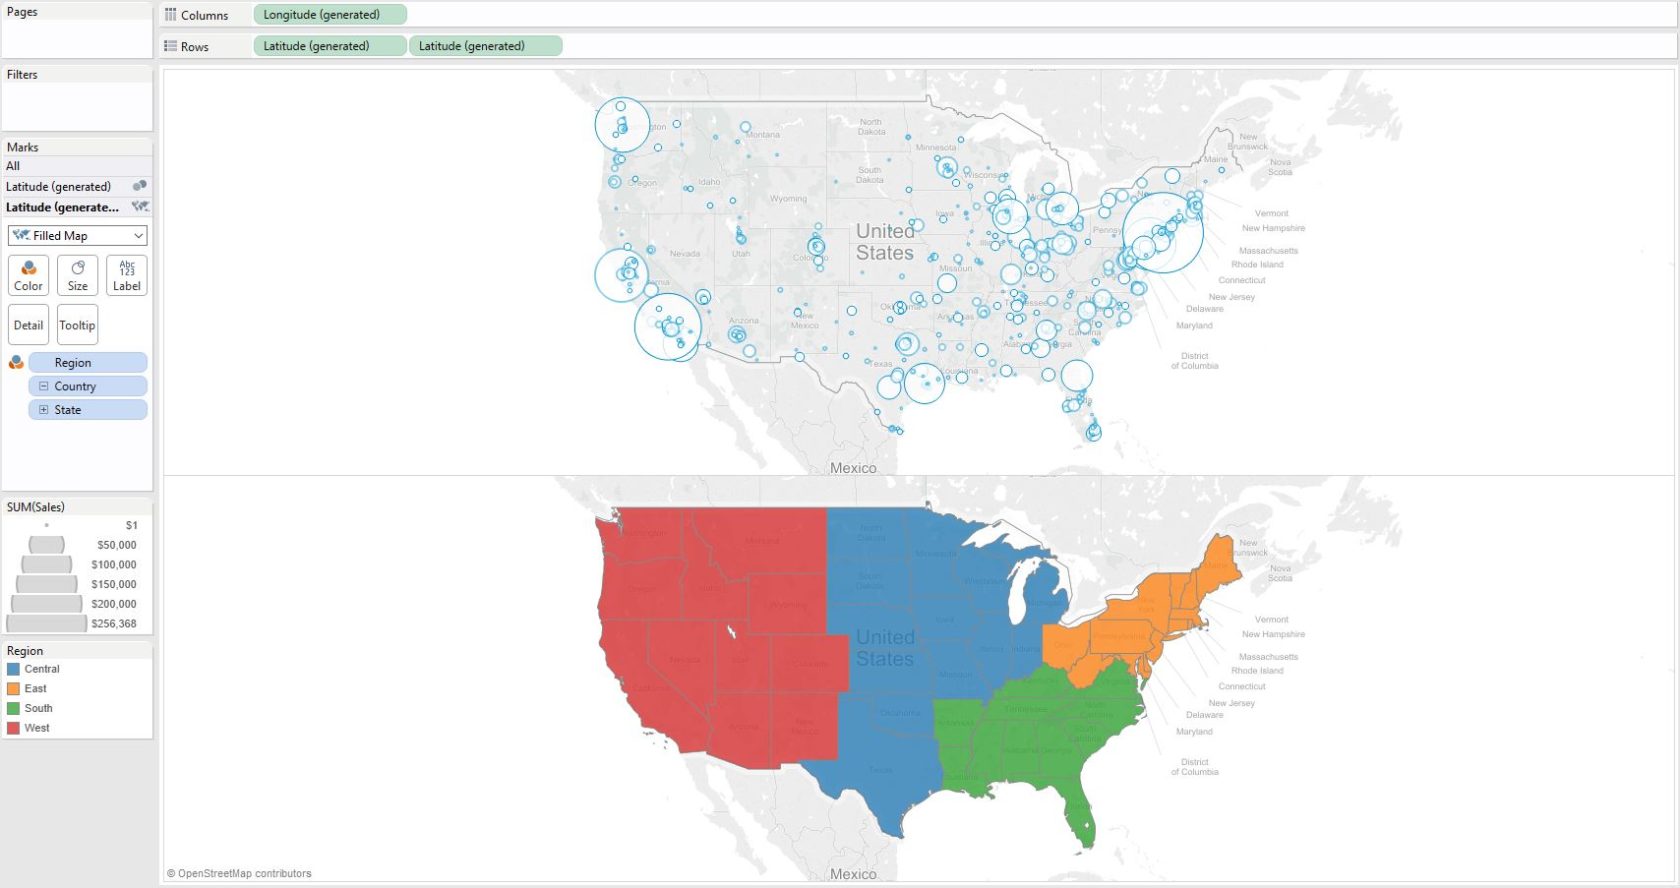
In this example, we will leave the first map as is, but change the second map to be a filled map by region.
To format the map for our example, follow these steps:
- Navigate to the second Marks Shelf
- Remove the Sales Measure
- Remove the City Dimension
- Add the Region Dimension from the Dimensions Shelf to the Color Marks Card
We have now got two distinct maps in our view.
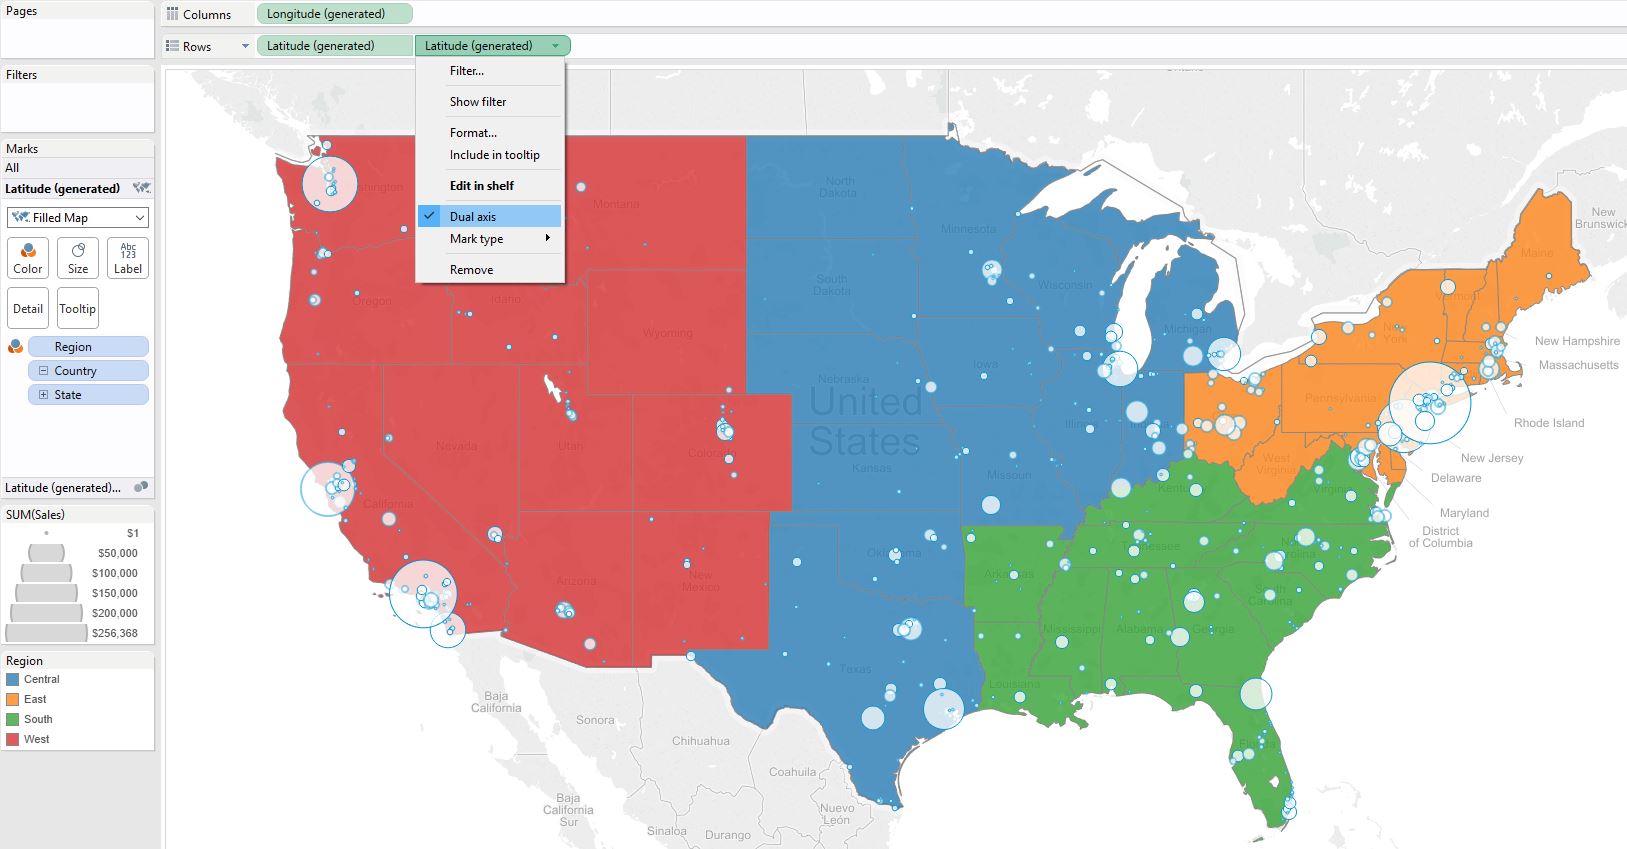
To combine the maps, click on the second geographic measure on the Rows or Columns Shelf (depending on whether you duplicated Longitude or Latitude) and click “Dual-Axis”. If you want to change the float order of the maps, drag the second geographic measure on the Rows or Columns Shelf to the first position.
Our final map looks like this:
Written By

Evolytics
This post is curated content from the Evolytics staff, bringing you the most interesting news in data and analysis from around the web. The Evolytics staff has proven experience and expertise in analytics strategy, tagging implementation, data engineering, and data visualization.