Parameters are one of the most powerful tools available in Tableau for exploring your data and providing interactivity to your end users. The best way to think of parameters is that they act as wildcards. In the simple algebraic equation 2X = 16, the value of X would be the parameter; in this case, equal to 8. The reason parameters are so powerful is that you or your end users can change the value of X from 8 to any number, which will change the results of a view.
In this Tableau 201 post, we will use this concept to create a What-If analysis that will show us what would happen if we improved our sales from 0 – 100%. Parameters come in many different forms, but for this post, we will be creating a parameter from integers, or whole numbers. For this exercise, we are using the Superstore dataset that comes with every download of Tableau if you would like to follow along.
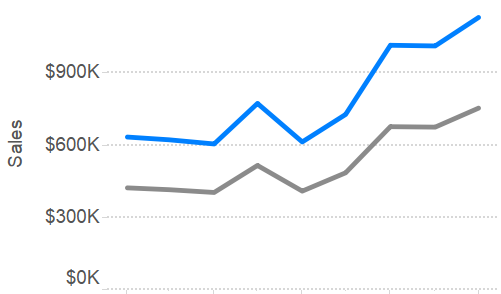
Let’s start by creating a simple line graph showing sales over time:

To create a parameter, right-click in the Parameters window in the bottom left corner of the sheet view and select “Create Parameter”. This is where you can choose from six different data types. We only want the ability to select non-fractional numbers, so choose “Integer” as the data type. There are some additional options available including the current value (which will be the default value the first time you use the parameter), allowable values, and within “Range”, minimum value, maximum value, and step size.
For the purpose of this what-if analysis, we will set the current value to zero, which will end up not changing our view at all the first time we use the parameter. We will also choose range and set the range from zero to 100 with a step size of five. This means that the end user can select any number between zero and 100 in increments of five.

This parameter is a dependent variable, meaning that it does not do anything on its own. To use it in our view, we will create a calculated field that leverages this parameter to calculate the value dynamically. We are interested in creating a what-if analysis that shows how our sales would change if they improved by 0 – 100 percent. There are couple of ways to write this calculation; here is one:
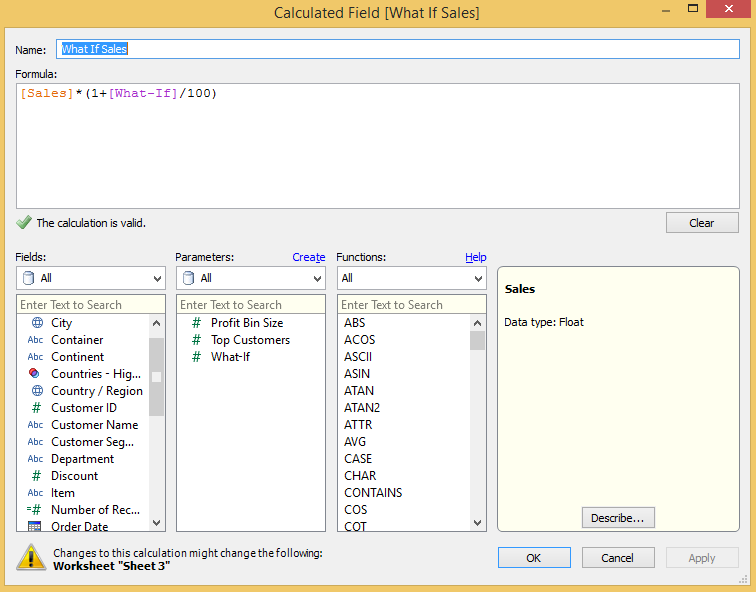
Notice that parameters are colored purple and can be used in a formula just like any other field in your calculation.
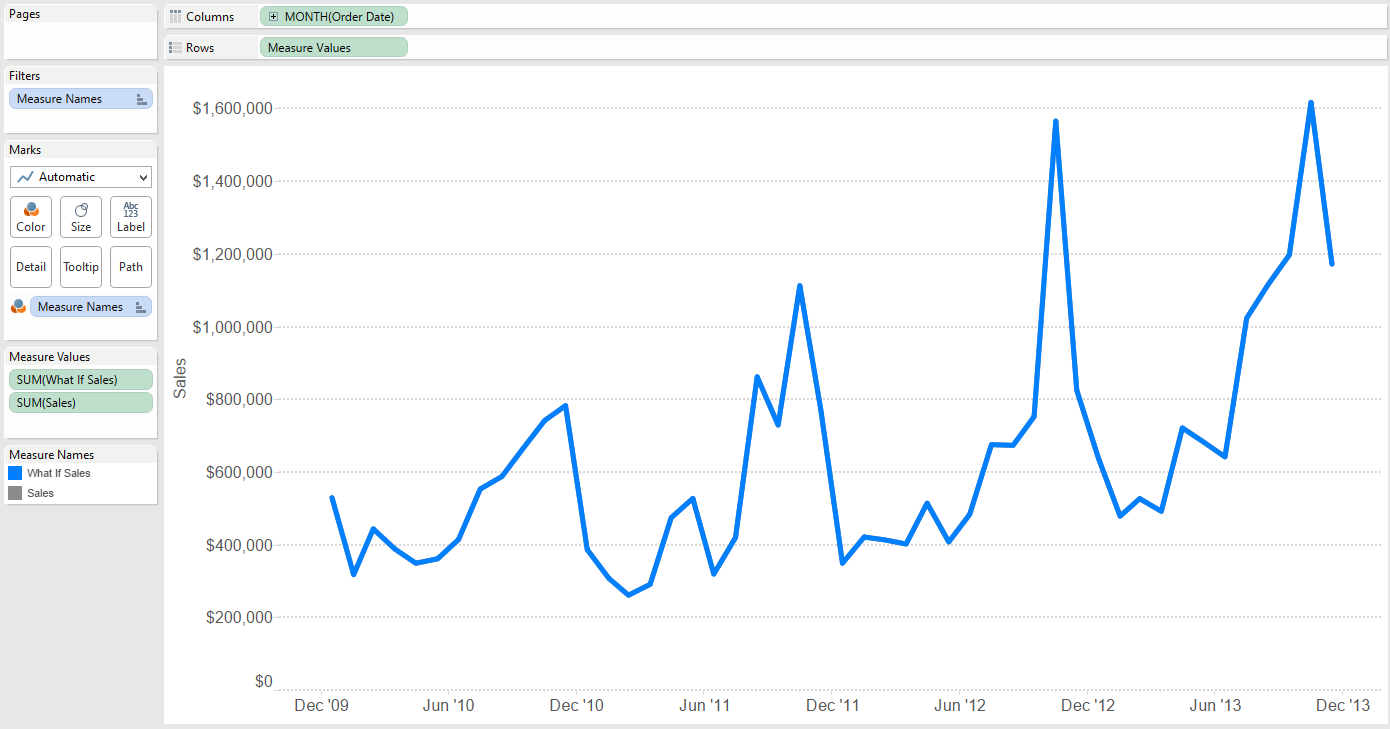
Now that we have our parameter in a calculated field, we can use it in a view. To create two lines on the same axis, one for actual sales and one for what-if sales, we will drag our newly created calculated field onto the existing axis for sales. For this view, we have changed the colors of the measure names and placed the line for what-if sales on top of actual sales by dragging what-if up in the Measure Names legend. At this point, your view should look like this:
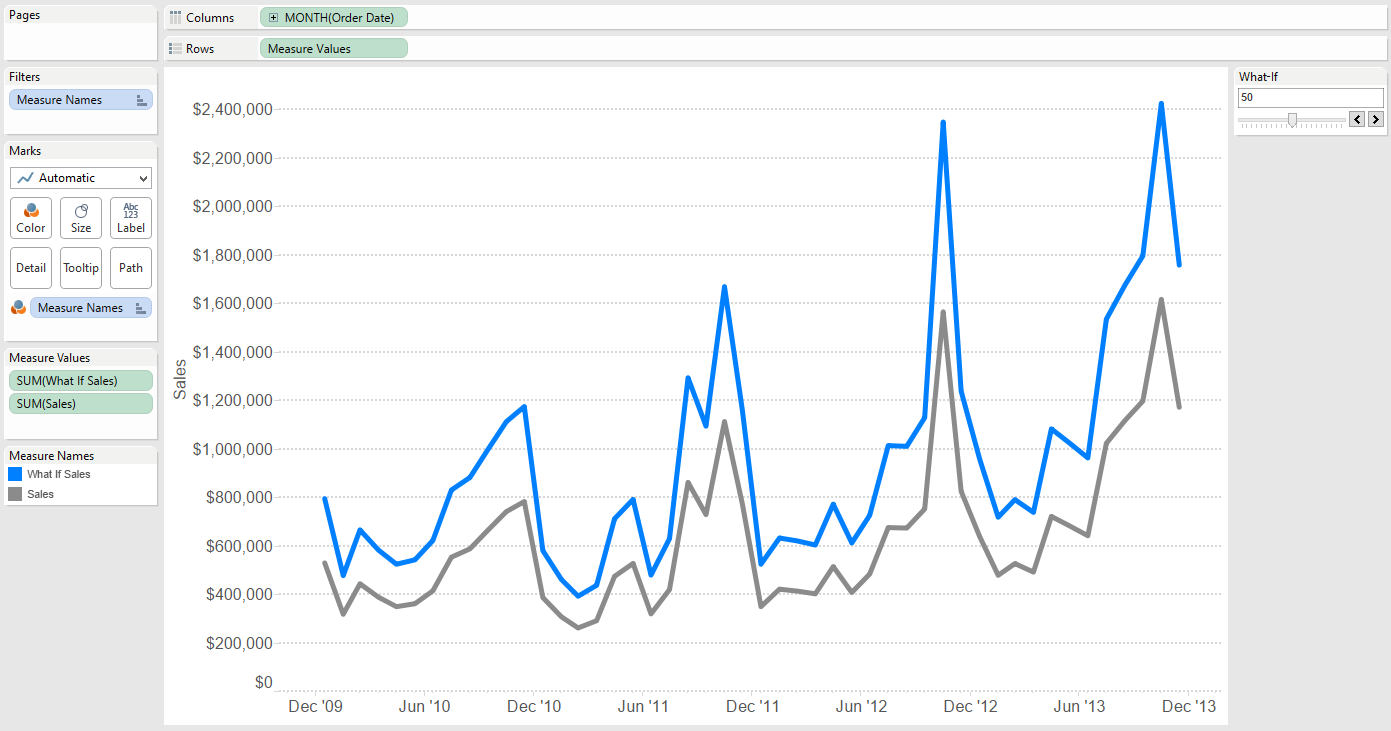
There is one last step needed in order to utilize your parameter. Right click on the What-If parameter and select “Show Parameter Control”. You now have a way to control the input for the What-If Sales Calculated Field. Notice that the inputs available are the ones that we set up when we first created the parameter; a range of zero – 100 in increments of five.
For additional ways to provide interactivity to your end users, see tip eleven in our Data-Driven Storytelling series, Allow Discovery.
Written By

Evolytics
This post is curated content from the Evolytics staff, bringing you the most interesting news in data and analysis from around the web. The Evolytics staff has proven experience and expertise in analytics strategy, tagging implementation, data engineering, and data visualization.