
Scenario: The data set that you’re working with in Tableau has several dimensions that represent different customer segments such as Married vs. Single, New vs. Returning, RFM Score, or whatever segments are important to your business.
It’s good that these dimensions are available to slice and dice the data by, but it’d be great if you and your end users could change these on the fly, without having to drag and drop the segment of interest onto the view every time you wanted to slice the data by a different segment.
It would be even more amazing if you could somehow create a segment hierarchy, allowing you to drill down to different combinations of segments (i.e. Married or Single in the first column drills down to Married or Single, plus a second column for New or Returning).
Solution: We’ve recently shared how to change the aggregation of dates and perform what if analyses using parameters, and once again, the power of parameters will be our solution today to dynamically compare and create segments.
In this case, we will create two string-based parameters that will be used to create our combinations of segments.
Step 1 – Create a Parameter for Segment 1
For demonstration purposes, we are going to use the dimensions available out of the box with Tableau’s Sample Superstore data.
You will likely have segments that are more practical in your data, such as the examples mentioned in the opening sentence above (Marital Status, New vs. Returning, etc.).
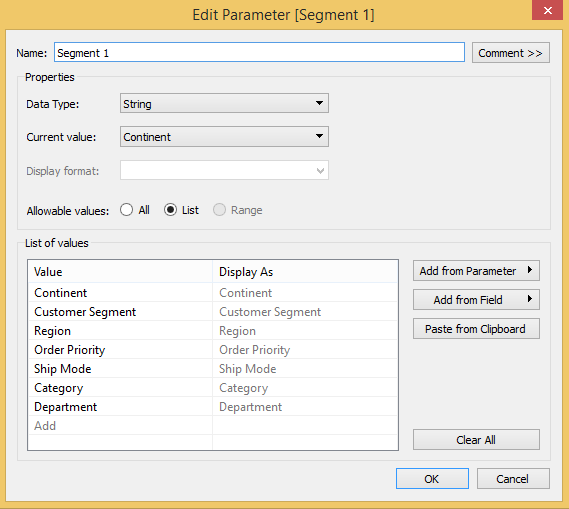
Create a string parameter with a list of the dimensions you want to be able to use in your segmentation:
Step 2 : Create a Calculated Dimension for Segment 1
Remember, parameters are dependent, and do nothing on their own.
In order to get this parameter to eventually work in our views, we need to create a calculated field that gives Tableau instructions on how to use the parameter.
To create our first segmentation, we need to tell Tableau which dimension to display based on the selection made in the Segment 1 parameter.
This turns out to be a simple mapping exercise, with the following logic:
CASE [Parameters].[Segment 1]
WHEN “Continent” THEN [Continent]
WHEN “Customer Segment” THEN [Customer Segment]
WHEN “Region” THEN [Region]
WHEN “Order Priority” THEN [Order Priority]
WHEN “Ship Mode” THEN [Ship Mode]
WHEN “Category” THEN [Category]
WHEN “Department” THEN [Department]
END
Step 3 : Create a Parameter for Segment 2
If you want to have multi-level segmentation, create a second parameter for Segment 2.
This can be done by right-clicking on the Segment 1 parameter and clicking “Duplicate”.
Edit the copy and rename it “Segment 2”.
Step 4 : Create a Calculated Dimension for Segment 2
Instead of retyping all of the logic used to create the Segment 1 calculated field, just right-click on the Segment 1 dimension and choose “Duplicate”.
The only trick here is that you not only want to rename the copy to “Segment 2”, but you also want to change the parameter being used in the logic.
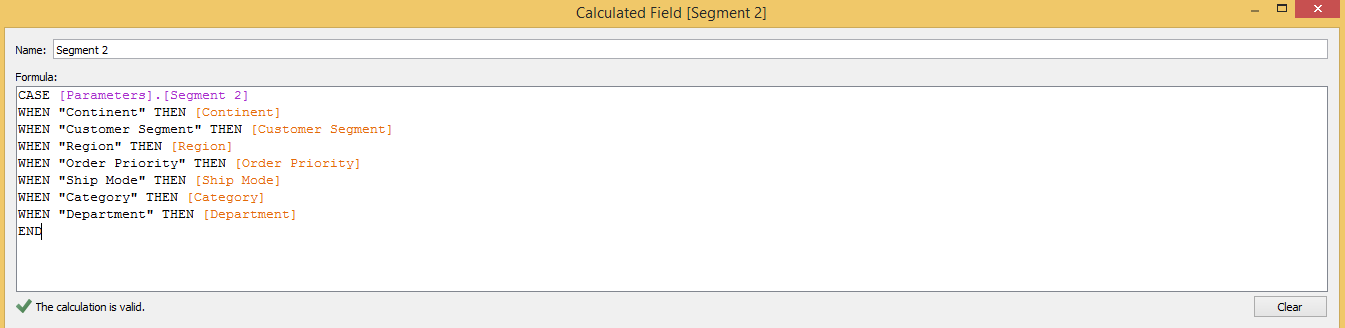
To do this, right-click on the Segment 1 copy, click “Edit”, and replace the number “1” with “2” in the first line. At this point, your calculated field for Segment 2 should look like this:
We now have the components needed to create a view that allows you and your end users to choose any combination of two segments. Here is a sparklines view with both segments:
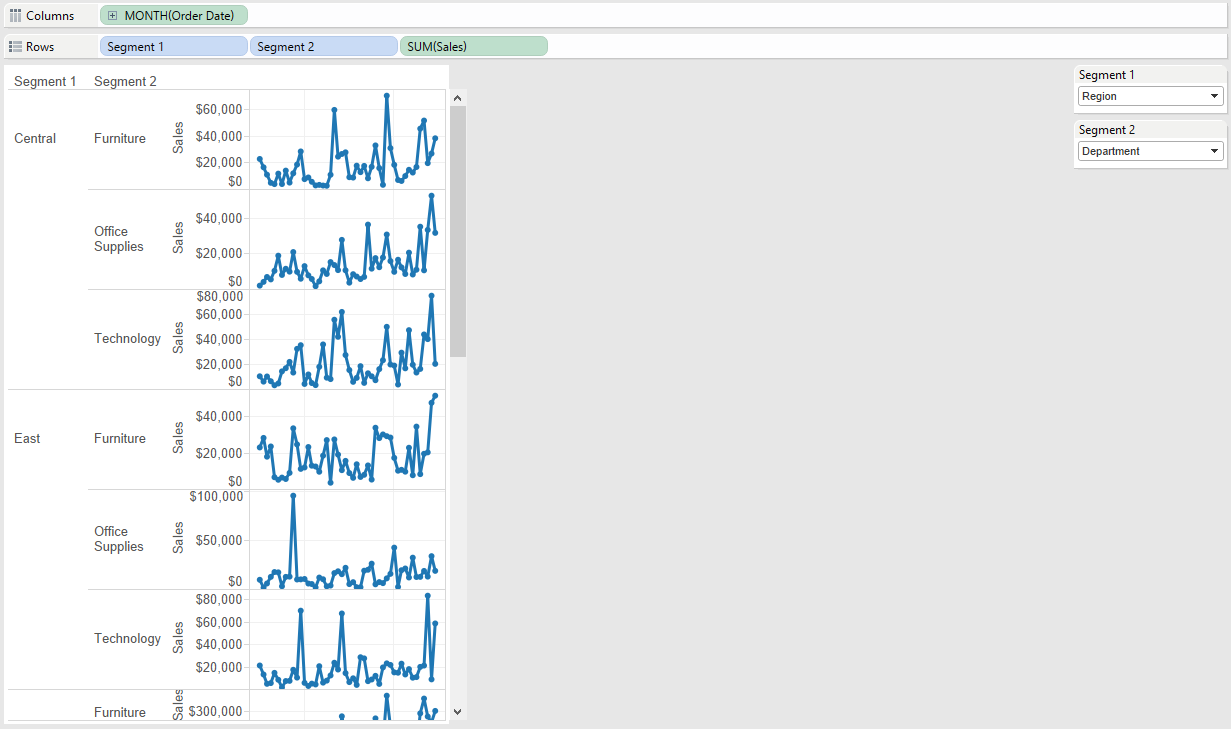
Creating sparklines is beyond the scope of this post, but the key is to right-click on the two parameters we created for segments and choose “Show Parameter Control”. This is what gives users the ability to change Segment 1 and Segment 2 on the view.
Note the controls in the top right corner.
If you need help creating Sparklines, see our Tableau 201 post, How to Create Sparklines in Tableau
This is awesome, please tell me other ways this can be used!
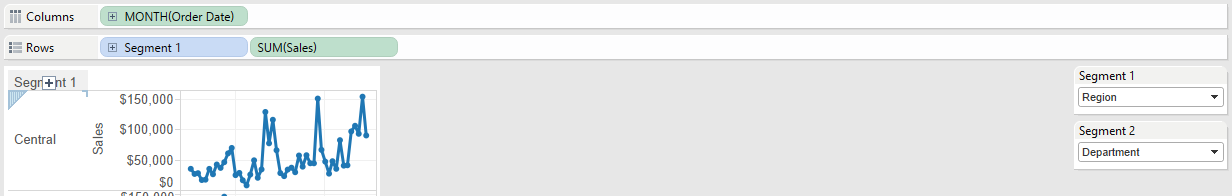
Option 1 – Create a Custom Hierarchy with Your Newly Created Segments
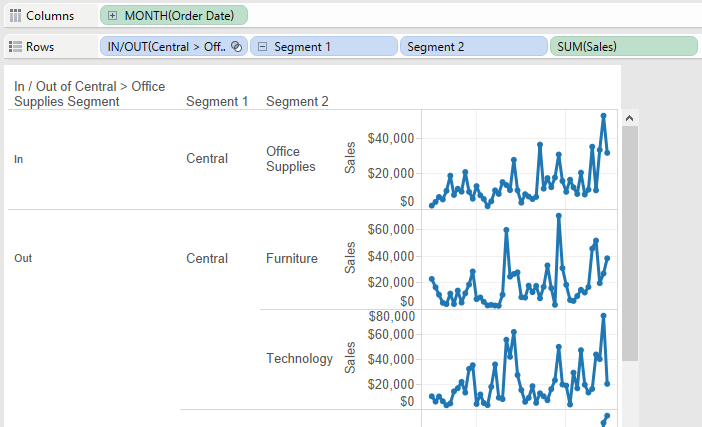
By creating a custom hierarchy using the Segment 1 and Segment 2 calculated fields, you and your end users will be able to drill down to the secondary level of segmentation and back up to the primary level of segmentation:
Option 2 – Create Additional Levels of Segmentation
You are not limited to two combinations of segments, though usability may become messy past three or so. If you would like to create more than two levels of segmentation, simply repeat steps three and four above.
Option 3 – Save a Specific Combination of Segments for Future Use
If you find a combination of segments that is particularly interesting, Tableau makes it very easy to create a set straight from the view. These sets can be reused on different worksheets for deeper analysis.
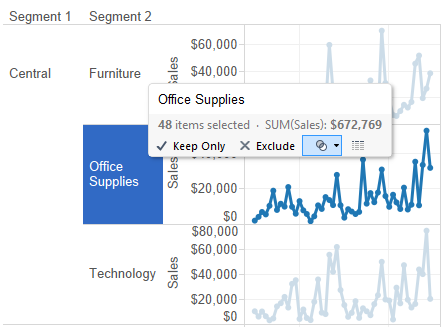
Let’s say we want to isolate the Region: Central > Department: Office Supplies combination for the months on our view. Simply click on the axis at the deepest level of segmentation, and click the Venn Diagram icon to create a set:
This set will appear in your left navigation and can now be used as a dimension on views, to filter, or within calculated fields.
Segmentation is one of the best ways to create comparisons that add value to your data visualization. The next time you are mining for stories in your own data, consider leveraging parameters to create custom segmentations on the fly.
Written By

Evolytics
This post is curated content from the Evolytics staff, bringing you the most interesting news in data and analysis from around the web. The Evolytics staff has proven experience and expertise in analytics strategy, tagging implementation, data engineering, and data visualization.