
Comparing an exact date in the current year to the same date in prior years – at least on the same date axis – is tricky in Tableau. The challenge comes from the lack of a “Month / Day” date aggregation option when using dates in Tableau. If we were to right-click and drag the Order Date dimension from the Sample – Superstore dataset in Tableau to the Columns Shelf, we are presented with these options (continuous fields in green; discrete fields in blue):
- Order Date (Continuous)
- Order Date (Discrete)
- YEAR(Order Date)
- QUARTER(Order Date)
- MONTH(Order Date)
- DAY(Order Date)
- WEEK(Order Date)
- WEEKDAY(Order Date)
- MY(Order Date)
- MDY(Order Date)
- CNT(Order Date)
- CNTD(Order Date)
- MIN(Order Date)
- MAX(Order Date)
- YEAR(Order Date)
- QUARTER(Order Date)
- MONTH(Order Date)
- WEEK(Order Date)
- DAY(Order Date)
- ATTR(Order Date)
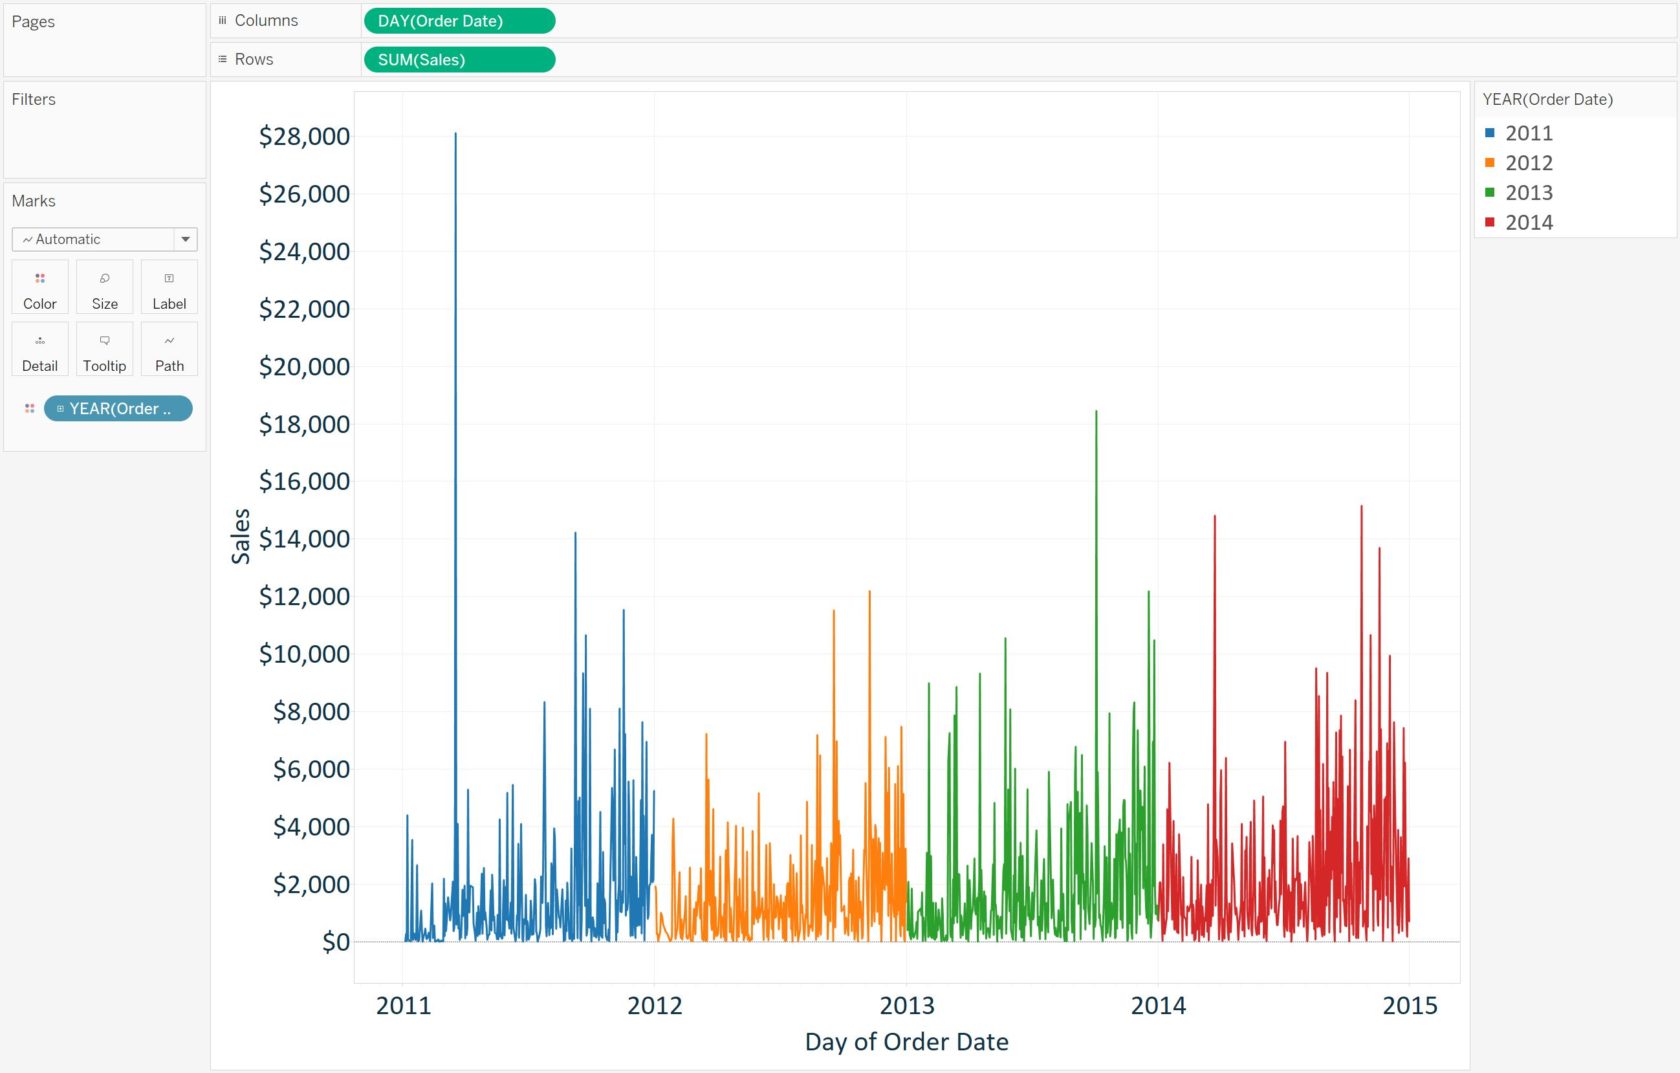
The only choices that include the most-granular, day-level aggregation that we’re wanting to use, also include year. This prevents us from having the lines for each year in the analysis overlap for easy year over year comparison. It also makes it impossible to choose a date range such as 2/1/2018 – 3/30/2018, and still be able to see a line for all of the years in this data (this range would filter the data to just the year 2018). To illustrate, if we looked at the Sales measure in the Sample – Superstore data by the continuous DAY(Order Date), then colored the lines by YEAR(Order Date), the view would look like this:
And if we wanted to choose a smaller range such as 2/1 – 3/30 for each year:
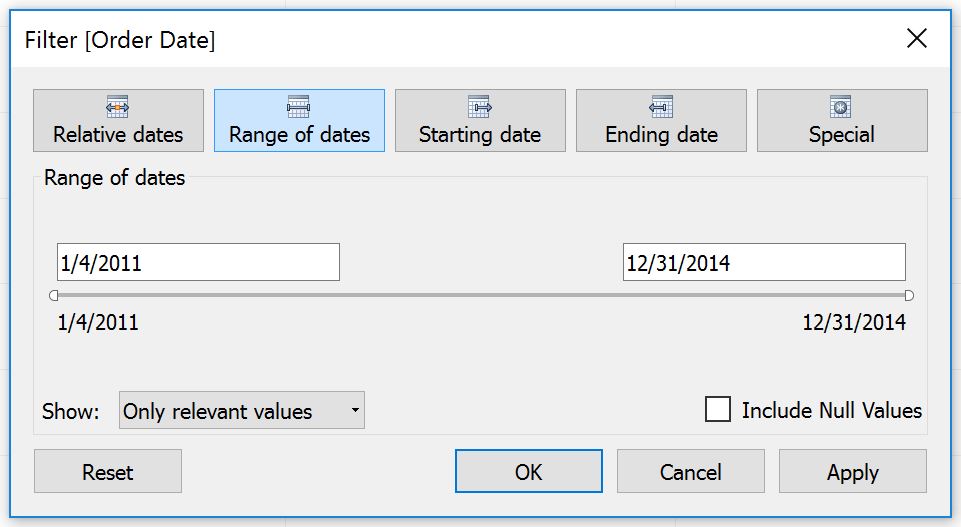
No luck because we have to choose the month, day, and year.
Method 1: Adding Years
One way to equalize year over year dates in Tableau is create a calculated field that adds the appropriate number of years to prior years, so that all of the dates end up on the current year’s axis. For example, if the year is 2018, you would equalize the year over year dates so that everything would be on an axis for the year 2018. If you were wanting to equalize three years of data, the formula would be:
IF YEAR([Order Date]) = 2018 THEN [Order Date]
ELSEIF YEAR([Order Date]) = 2017 THEN [Order Date]+365
ELSEIF YEAR([Order Date]) = 2016 THEN [Order Date]+365+365
ELSE NULL
END
This formula is saying that if the Order Date is in the current year, then show the Order Date; if the Order Date is sometime last year, show the Order Date from that year, but add 365 days to it to get the dates on the current year’s axis; if the Order Date is from two years ago, then add two years worth of dates; if the Order Date isn’t in the last three years, don’t show anything.
This solution works, but is a bit manual to set up and dealing with leap years is a confusing topic.
Method 2: Creating a Month / Day Aggregation
A second, and more effective approach, is to create a calculated field that provides the “Month / Day” date aggregation that was mentioned in the post introduction.
The formula for this calculation is:
DATE(STR(MONTH([Order Date]))+”/”+STR(DAY([Order Date]))+”/2018″)
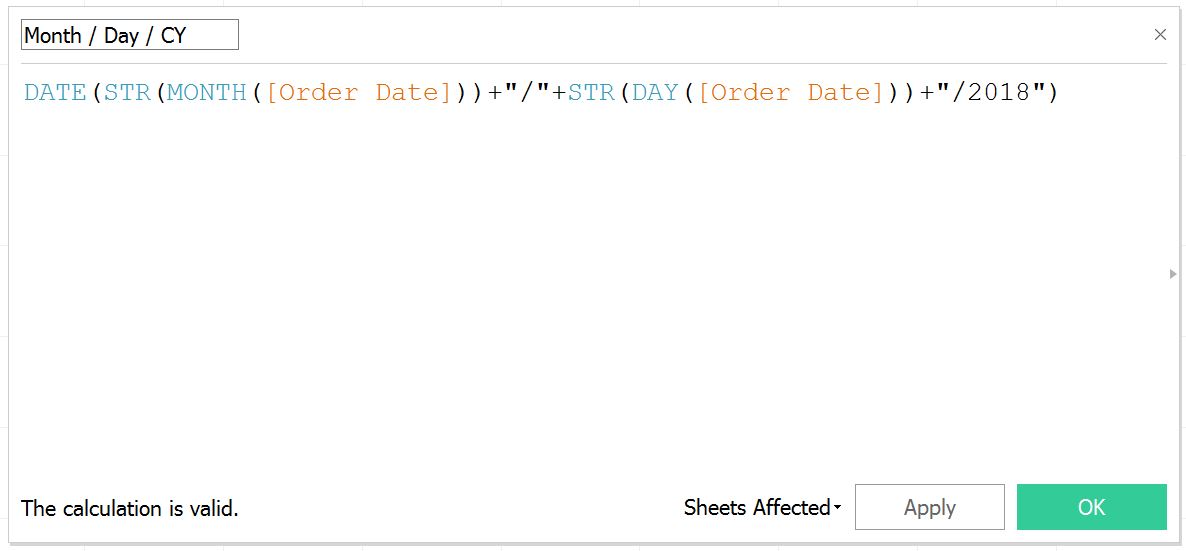
This calculation is telling Tableau to take the individual month and day from each Order Date, but make the year for all of them the current year.
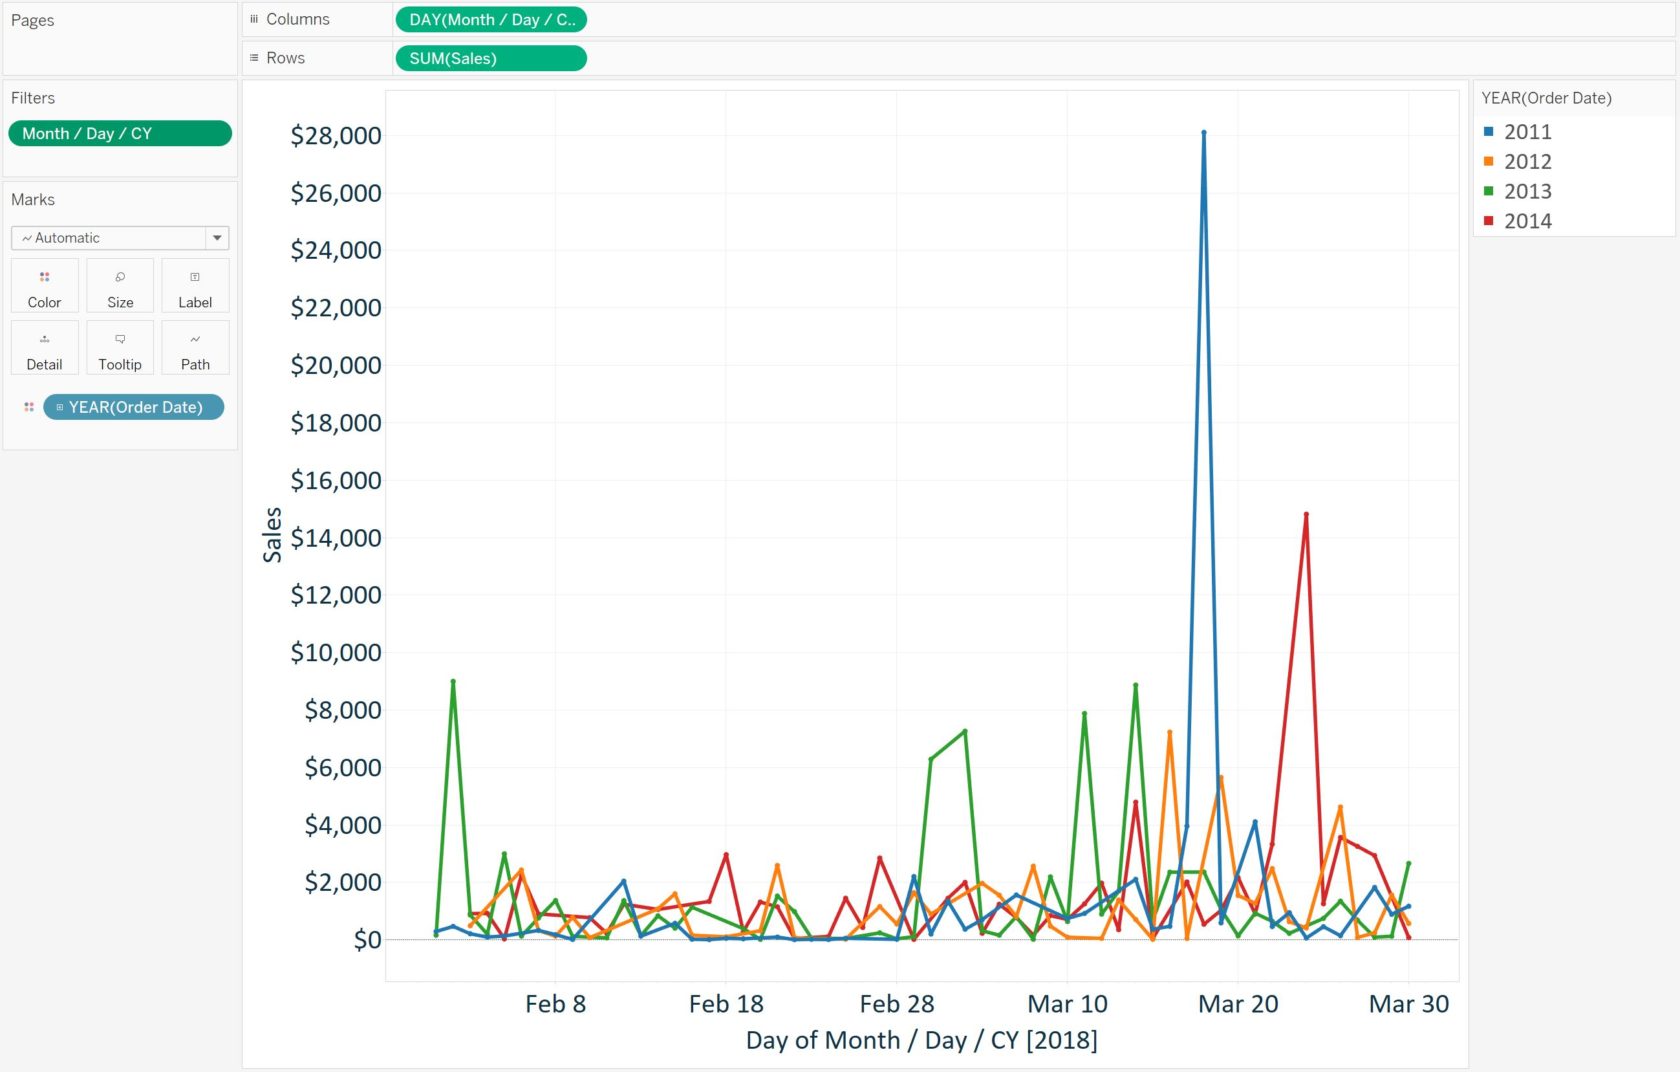
Now if we look at Sales by this Month / Day / Current Year calculated date, we can look at all of the years in my data on the same date axis:
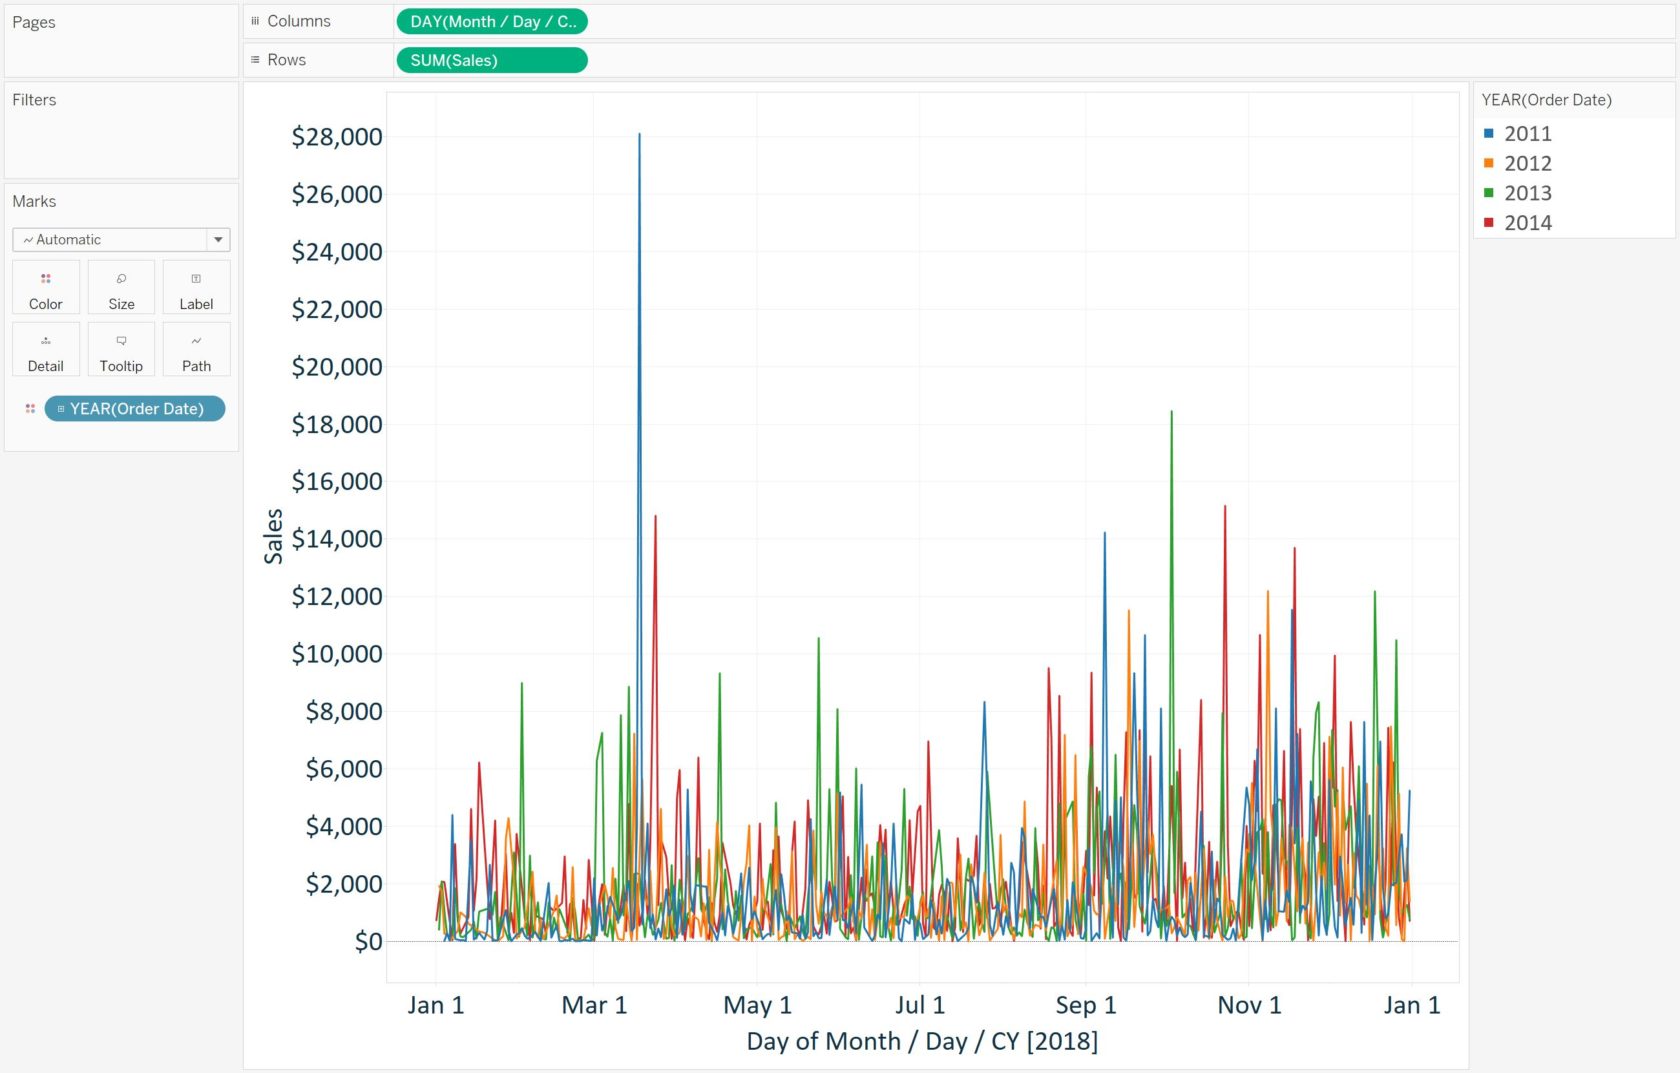
Note that if the year you are using for the date axis does not contain ‘Leap Day’ (February 29th), but one or more of the lines in the graph do, that line that contains Leap Day will add the result from February 29th to March 1st. Conversely, if the year you are using for the date axis does contain Leap Day, February 29th will be skipped for years that do not have Leap Day.
We can also use the newly created Month / Day / Current Year calculated field to filter the equalized date range. Changing the date range to 2/1/2018 – 3/30/2018 makes it much easier to compare individual, year over year dates, on the same date axis!
As a final note, now that you have the dates equalized on the current year axis at the most granular level, you can also change the aggregation to something less granular such as month or year and the dates will still line up.
Written By

Evolytics
This post is curated content from the Evolytics staff, bringing you the most interesting news in data and analysis from around the web. The Evolytics staff has proven experience and expertise in analytics strategy, tagging implementation, data engineering, and data visualization.