For many companies, Tableau is the data viz tool of choice to monitor and communicate performance in ways that various levels of the organization can quickly and easily understand.
At Evolytics, our clients’ needs frequently challenge us to find new ways to display data. We seek to answer complex business questions with user-friendly visualizations that remain reliable and scalable over time.
Unfortunately, even a tool as powerful as Tableau has limitations. However, Tableau is full of unexpected workarounds as long as you’re willing to get creative with the built-in functionality. Join us as we walk through some of our favorite Tableau hacks in the following blog posts.
How to Create Cross-Database Unions
Tableau doesn’t natively allow cross-joining different database types in a single workbook. This creates a challenge when data is in different databases and cannot be consolidated, like when large organizations need to view data across departments. This hack outlines a step-by-step process to bypass this barrier using unions and a scaffolding technique.
Check Out the Tableau Cross-Database Union Hack Tutorial
How to Show Total Labels on Bar Charts Using Reference Lines
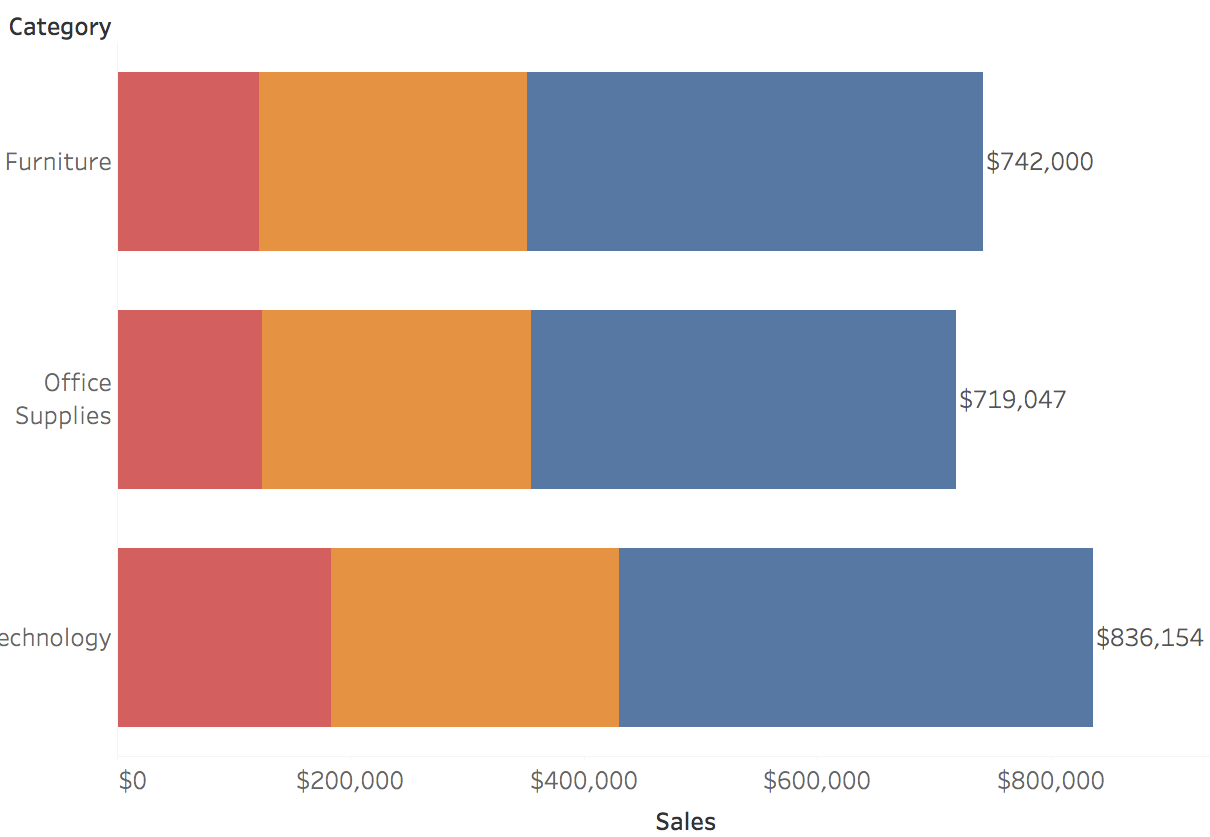
Tableau’s default label settings do not always meet our needs. For example, when creating a bar graph and color-coding by Segment, Tableau will also label color-coded sections by Segment by default. Using reference lines at the cell level enables a user to label each bar by Category totals instead, giving more context to the difference between the bars overall.
Learn More about Using Reference Lines to Show Total Labels in Tableau
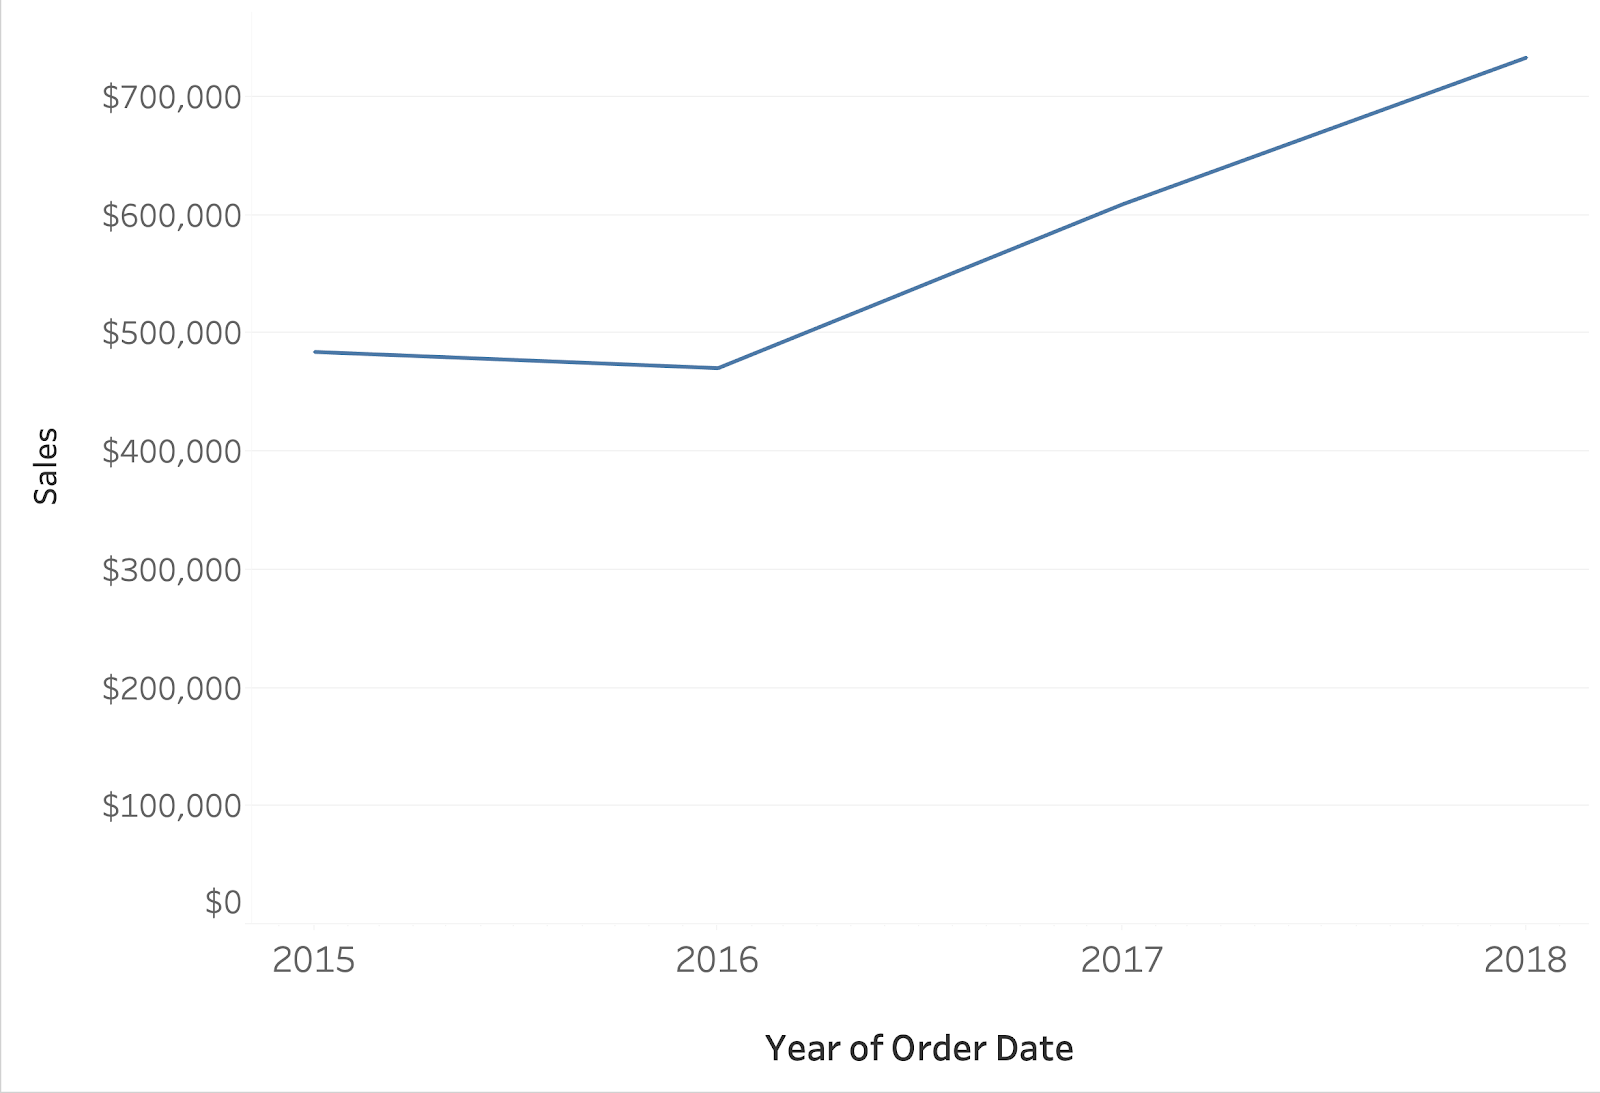
How to Allow the User to Change Date Aggregation
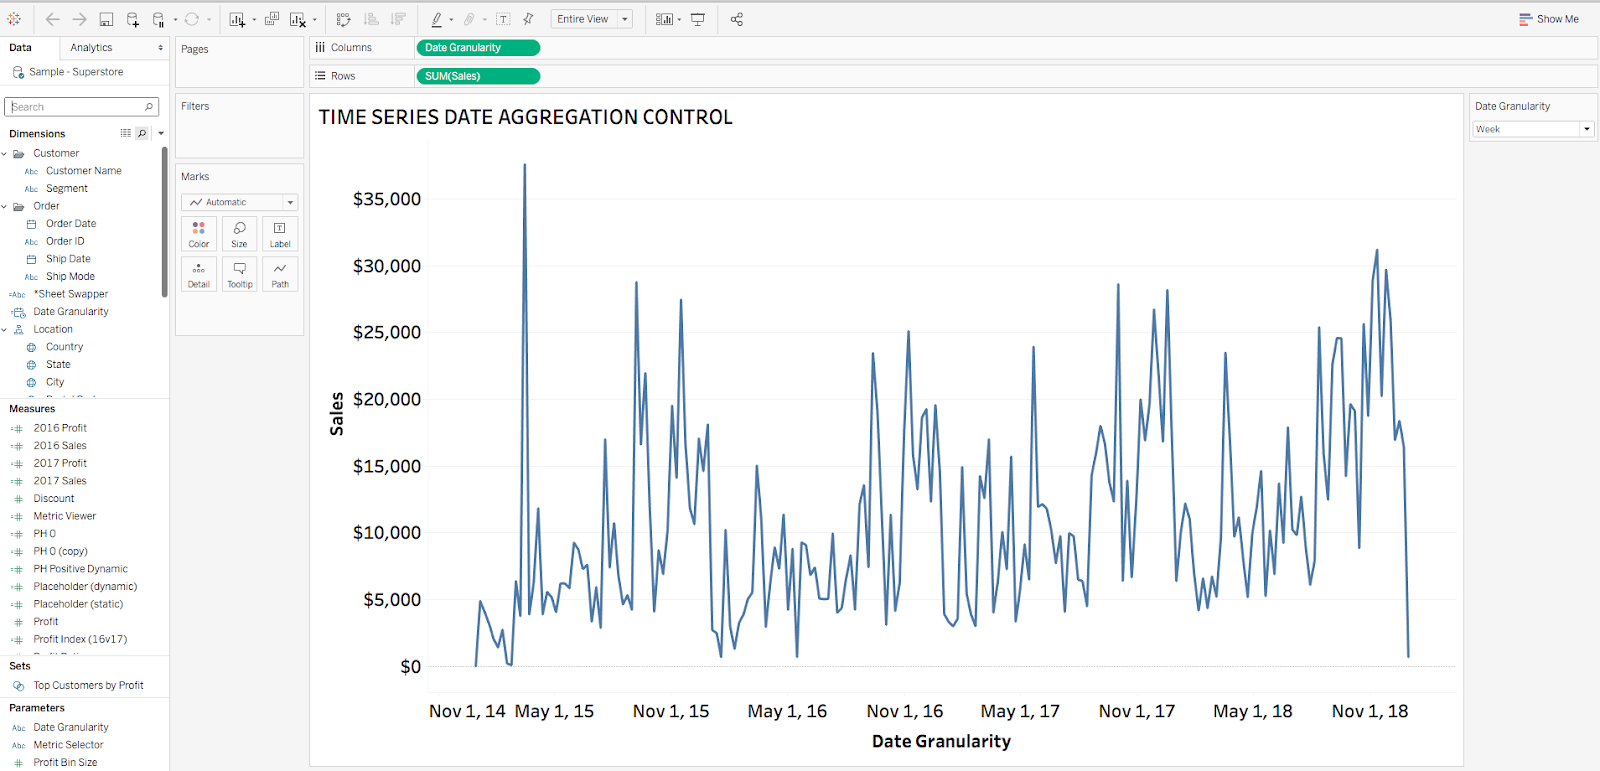
A common client request is the ability to switch date aggregation (such as Daily to Weekly) on a dynamic date axis. For example, a date switcher parameter would allow an end user to easily switch between different levels of date granularity to compare trended annual averages for the “big picture” and then dig deeper into months, weeks, or days that caused dips or spikes in performance.
Learn How to Create a Drop-down Parameter for Changing Date Aggregation in Tableau
Using Sheet Swapper to Change the Format of Measures on an Axis
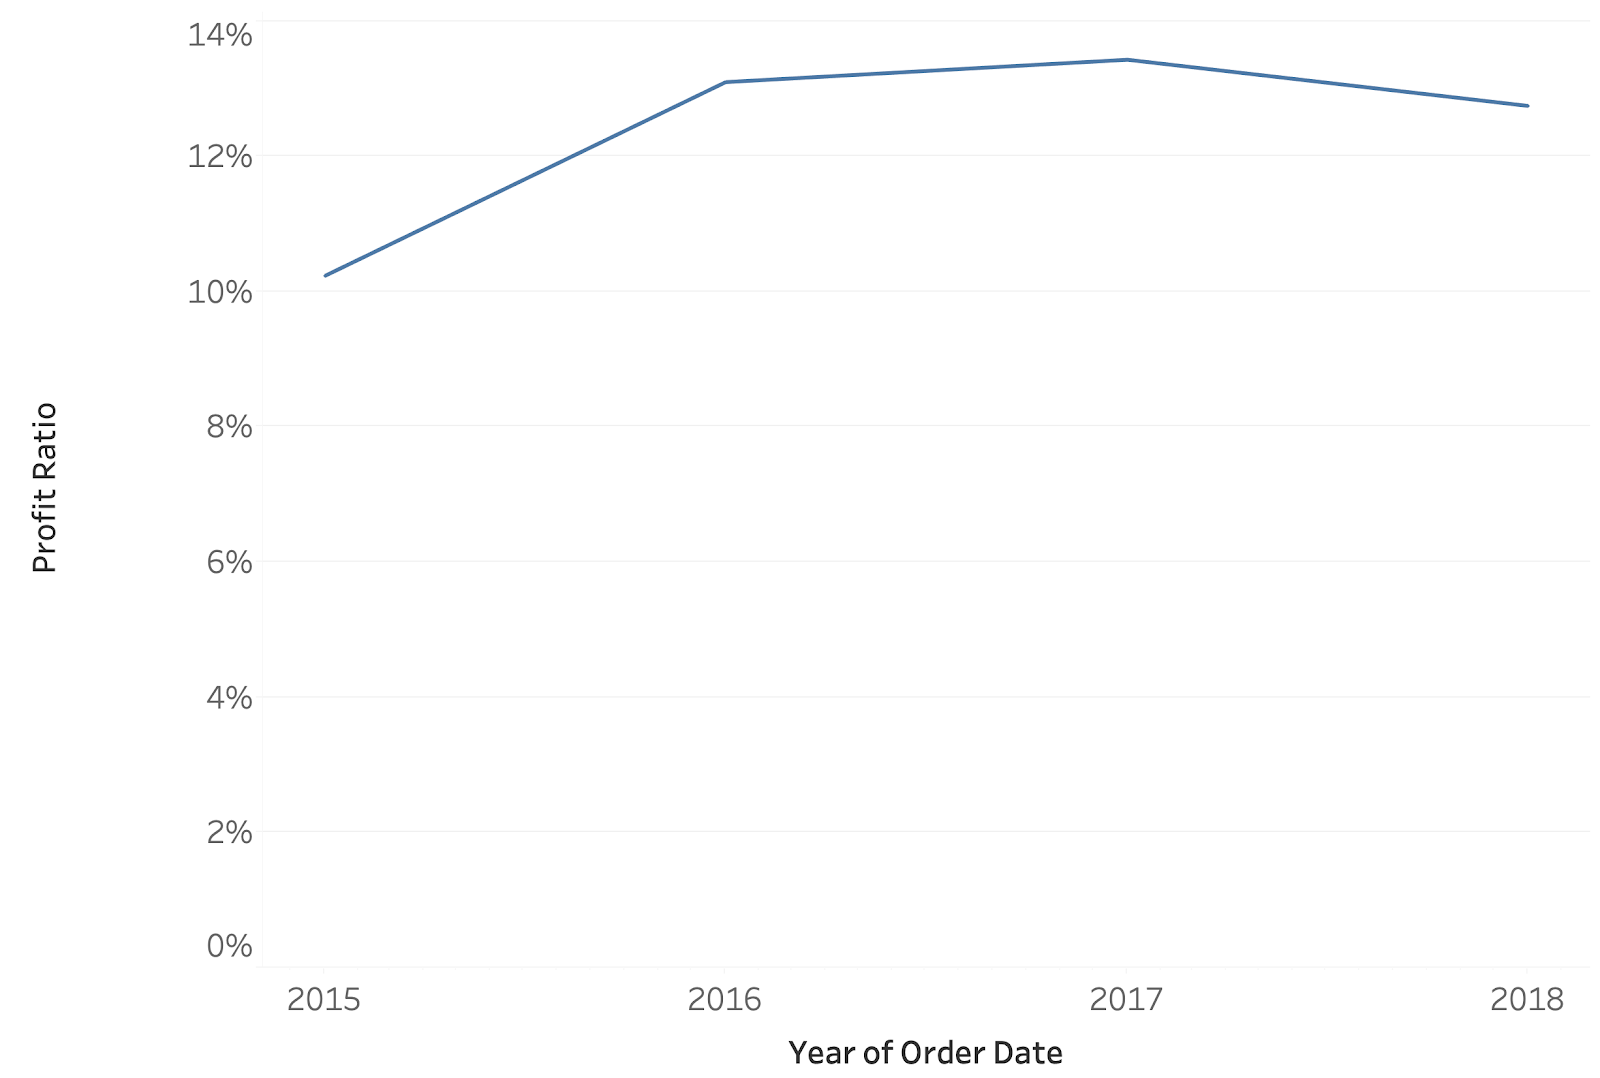
We’ve found that the ability to toggle between different data types, such as percentages and currencies, on the same chart is quite impressive to stakeholders and can also save lots of precious real estate on a dashboard. This hack is accomplished by building multiple worksheets that each contain a different version of a visualization, then adding a calculated field to select which worksheet to ultimately display. This allows the end user to “magically” swap metrics and data formats on the same axis.
Read the Step-by-Step Guide on How to Swap Sheets in Tableau
Creating Custom Step Color Palettes Based on Different Goals
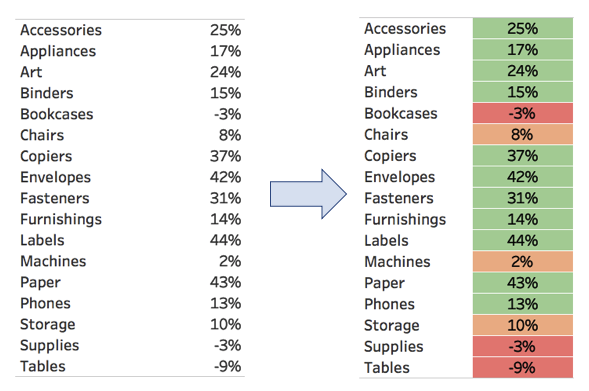
Though Tableau natively includes a wide variety of color palettes, they do not always meet our specific visualization needs. Custom color palettes allow color-coding based on specific targets and business requirements however. We can adjust the Tableau Preferences.tps document in the “My Tableau Repository” folder with custom color preferences and scales to use in our Tableau visualizations.
Read the Step-by-Step Guide for Creating Custom Step Color Palettes in Tableau
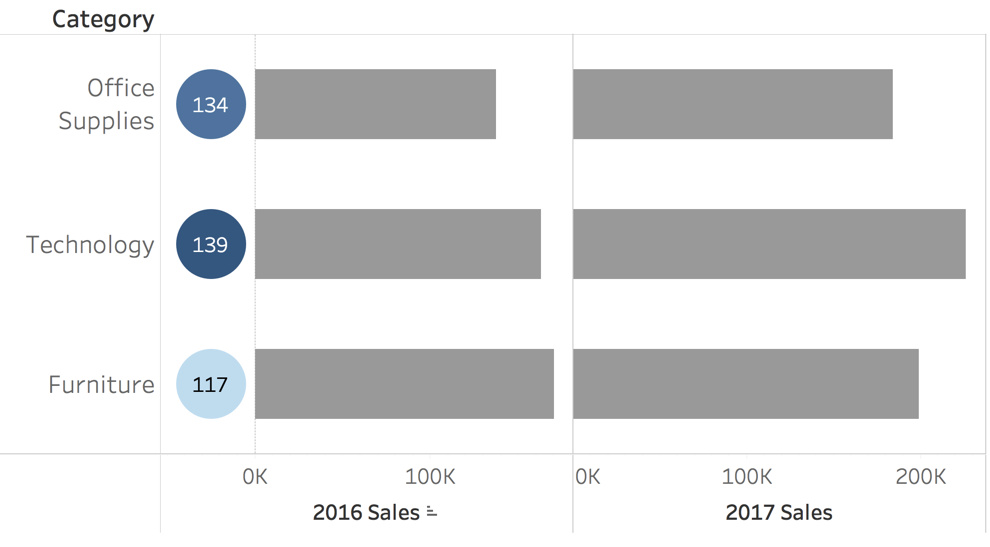
How to Customize Positioning of Different Mark Types in the View using Placeholders
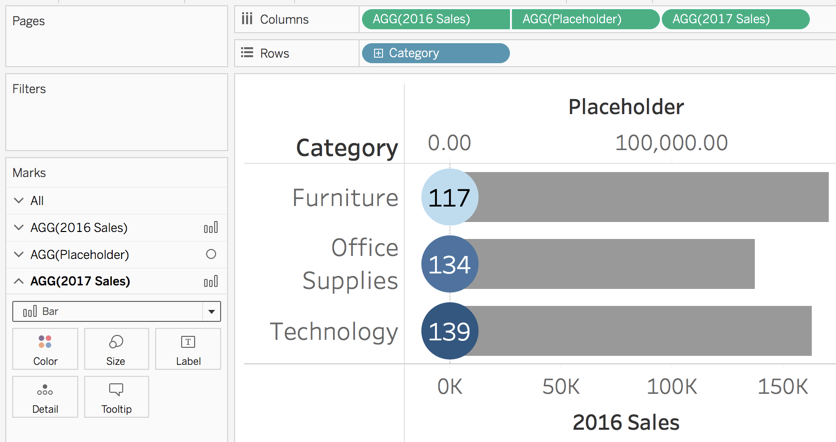
This hack opens the door for a wide variety of customization options that would not otherwise be possible within Tableau. Tableau frequently defaults to a recommended order to display Measure Names and Values and prefers these items to have the same qualities (shape, tooltip, color coding).
Using “placeholder” values, however, you can visualize multiple measures with different mark types and position them exactly where you want in a single visual. We also walk through how to ensure the size of your graph and placeholder position adjusts dynamically as you filter and rescale your chart.
We hope these hacks help you work around some of your more challenging Tableau problems. For more Tableau hacks and tricks, be sure to check out the data viz section of our blog.
Content originally presented at the Kansas City Tableau User Group (TUG) Q2 meeting hosted by Evolytics in partnership with Parkville University’s Information Systems and Business Analytics program.
Written By

Evolytics
This post is curated content from the Evolytics staff, bringing you the most interesting news in data and analysis from around the web. The Evolytics staff has proven experience and expertise in analytics strategy, tagging implementation, data engineering, and data visualization.