
The Measurement Blog is curated content from the Evolytics staff, bringing you the most interesting news in data and analysis from around the web. The Evolytics staff has proven experience and expertise in analytics strategy, tagging implementation, data engineering, and data visualization.
THE MOST POPULAR THANKSGIVING FOODS IN ALL 50 STATES, MAPPED
MENTAL FLOSS | ARTICLE
There’s nothing the Evolytics office loves more than new data to analyze, especially when it’s presented as a data visualization. Using search data from various recipe websites during the month of November, General Mills compiled state by state insights to understand regional trends and preferences during Thanksgiving.
You will find yourself trying to predict who is most likely to eat shrimp on Thanksgiving and implement one of the popular Thanksgiving breakfast options.
THESE ARE THE WORST TIMES TO DRIVE AND SHOP THIS THANKSGIVING
CNBC | ARTICLE
Crowdsourcing traffic app Waze crunched the numbers on 2016 traffic data to give users actionable insights into what they predicted would be the most heavily trafficked drive times.
Want to create a strategy for your Thanksgiving week commute? Put Waze data to the test.
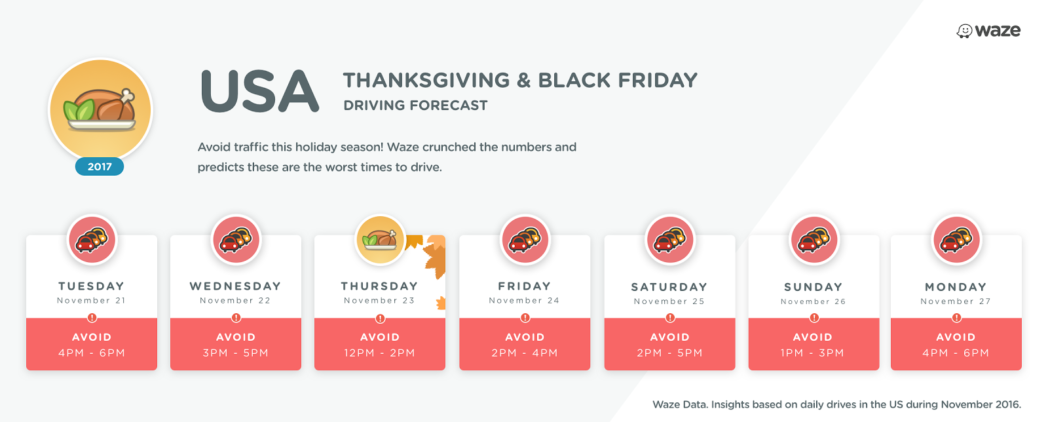
Any interesting tidbits? For starters, if you procrastinated until Thanksgiving Eve to go grocery shopping, there’s a 63 percent increase in navigations to the grocery store, with peak travel time at 3pm. Additionally, you may think Black Friday starts early, but commutes to retailers peak between 11am and 3pm.
Evolytics team members are particularly excited about apps like Waze because we love seeing how data can change the world. When your GPS reroutes you to avoid traffic that’s slower than molasses, thank big data.
WILL THE US HAVE A SNOWY WHITE THANKSGIVING?
LIVE SCIENCE | BLOG
Did you know that Fort Garland, CO was the first location to record Thanksgiving weather data, doing so in 1863? Or that Old Faithful, WY has a perfect record of Thanksgiving snow dating back to 1906?
Who aggregated all of this old snow data, and why does it matter?
@Climatologist49, Brian Brettschnieder, compiled 154 years of US and Canadian data to predict the likelihood of a snowy Thanksgiving in locations across the United States. Want to know your chance of snow? There’s a data visualization for that here.
Written By

Evolytics
This post is curated content from the Evolytics staff, bringing you the most interesting news in data and analysis from around the web. The Evolytics staff has proven experience and expertise in analytics strategy, tagging implementation, data engineering, and data visualization.