The Challenge: Locating, shaping, and aggregation cross-database data
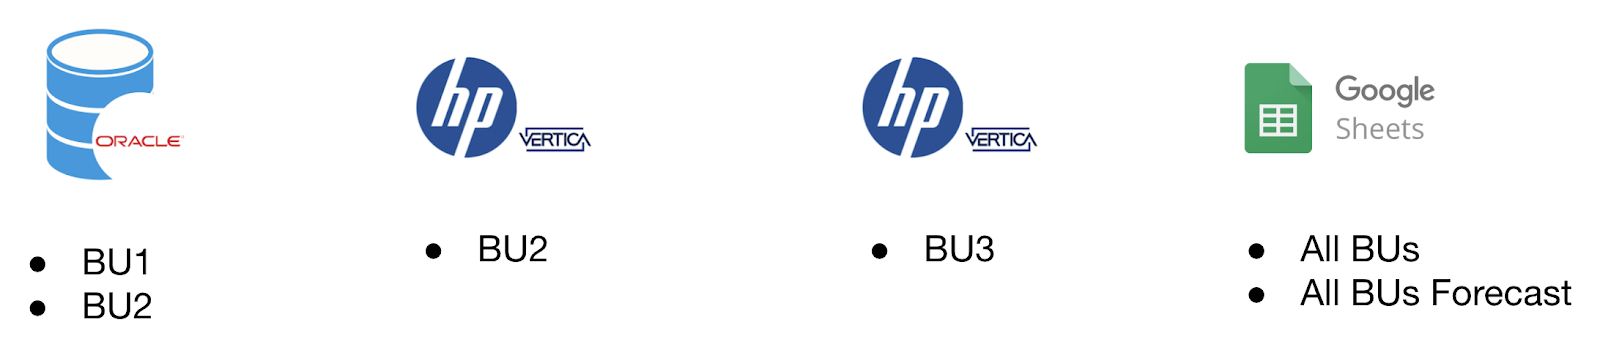
One of our clients needed an executive-level, company-wide dashboard to analyze metrics across all business units and in aggregate for the last two fiscal years. The dashboard itself was fairly simple, but the challenge was locating, shaping, and aggregating all the data. The business consists of three different business units with data residing in four different databases. The data sources include:
- Oracle EDW
- BU1
- BU2
- HP Vertica (instance 1)
- BU2
- HP Vertica (instance 2)
- BU3
- Google Sheet
- All BUs
- All BUs Forecast
To complicate matters even more, one business unit had data in two of these databases. We also needed to join in forecast numbers and other historical data that lived in a Google sheet. The challenge is that Tableau does not support cross-database unions.
The Solution: Using cross-database join to build a union
Tableau does not support cross-database unions, but it does support cross-database joins for nearly all data sources, which we leveraged to build a union.
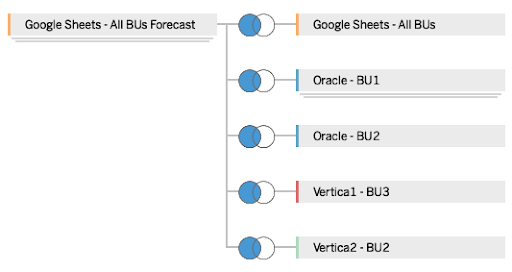
To hack a cross-database union, we performed a cross join, also known as a cartesian join To get started, we needed a ‘scaffold’ data source containing keys from each data source to serve as the left side of our cross join. In our specific case, we could use the Google Sheets forecast data as the scaffold data source since it contained data from all three business units and the necessary key fields (dates and business units).
The end result was a table on the left side of the join with three Google sheets unioned together containing forecast data. The right side consisted of five separate joins using historical data sources, keyed off business unit and date.
This cross join gave us all needed rows in one data source. The next step was creating consolidated fields for the dashboard, because the cross join produces null values in a third of the cells. This consolidation process proved extra tricky because we needed to weight measures on a daily level and also perform ratio calculations between them. Each data source had between five and ten original columns, depending on what metrics were involved, for a total of 48 columns. We ended up with 193 columns total after creating all calculations. Luckily, this was a high-level dashboard, so we structured the custom SQL queries to give us only three rows of data per day (one per BU), so performance was not a factor.
Below is a simplified example of what one day of records looks like in the final data source. I only included one metric for simplicity. We were also used the BU and Date fields from the forecast data source without consolidating since they existed on every row. We only had to consolidate measures for this project.

Tutorial: Step by Step Cross-Database Union in Tableau
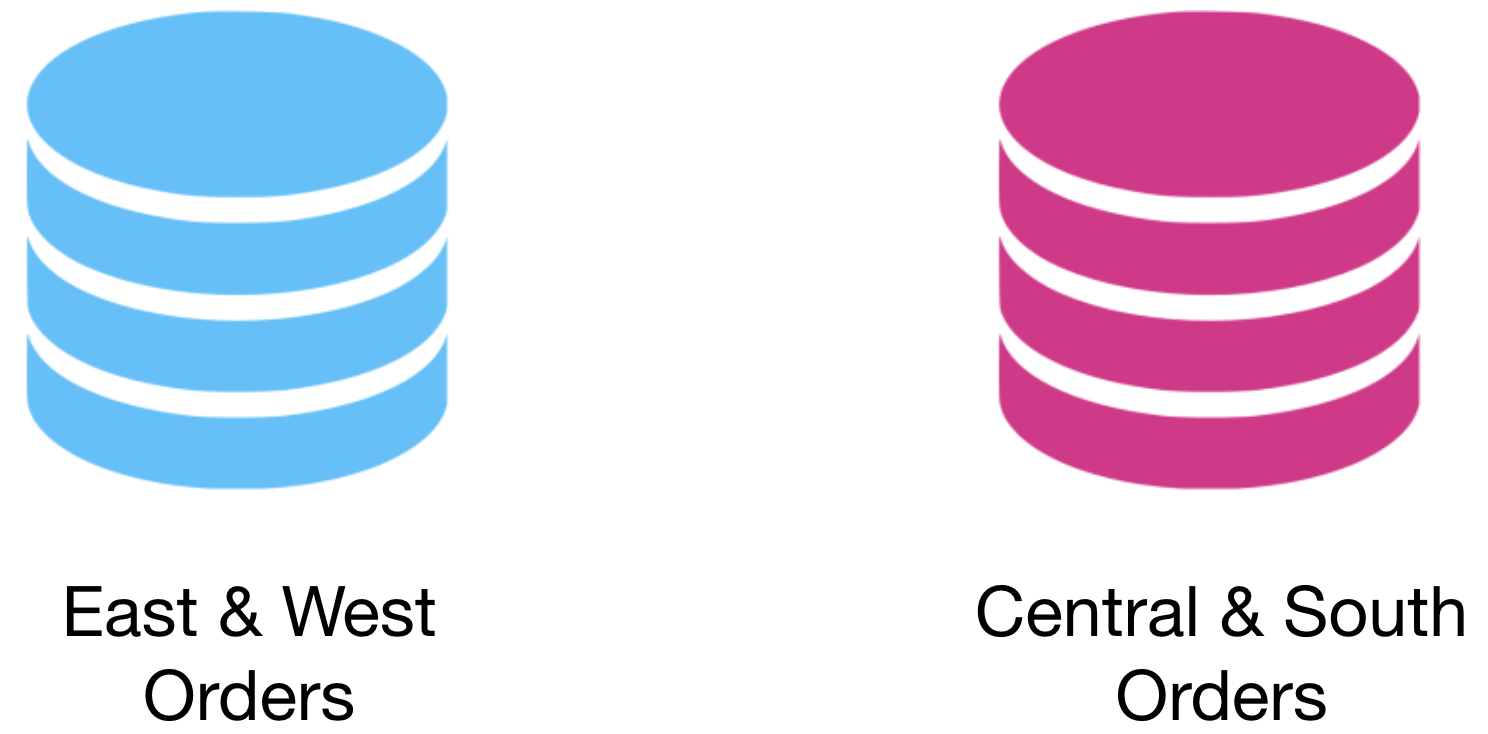
To explain how this works in detail, I will use Sample Superstore data. I split the data set into two files, one with data from East and West regions and the other with data from Central and South.
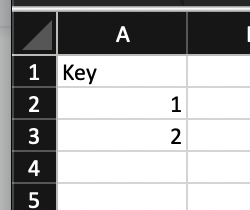
Step 1: Create Scaffold Data Source
Create an excel file with one column named ‘Key’ and two rows with values ‘1’ and ‘2’. If you need to union more data sources, simply keep adding rows with unique values.
Step 2: Connect and Join Data Sources
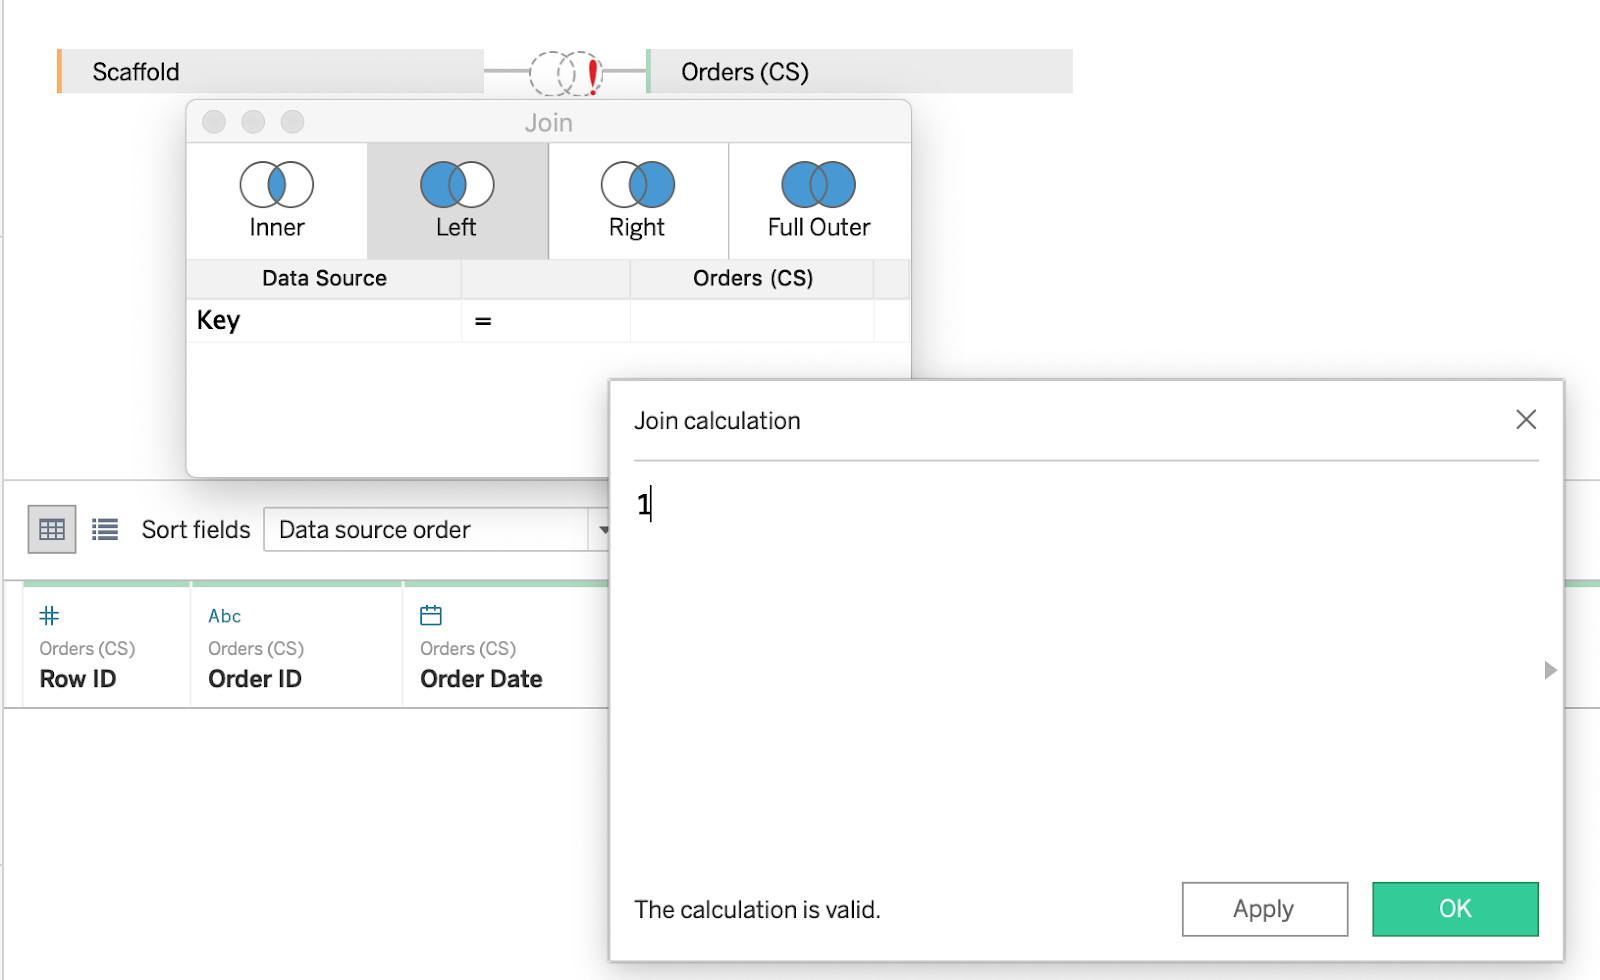
Open Tableau and connect each of your data sources. Then bring your scaffold data source out first as the left side of your joins. Next bring one of your “real” data sources out and set up a left join using the Key field from the scaffold and a join calculation with “1” as the value. The “Create Join Calculation” is at the very bottom of your list of fields.
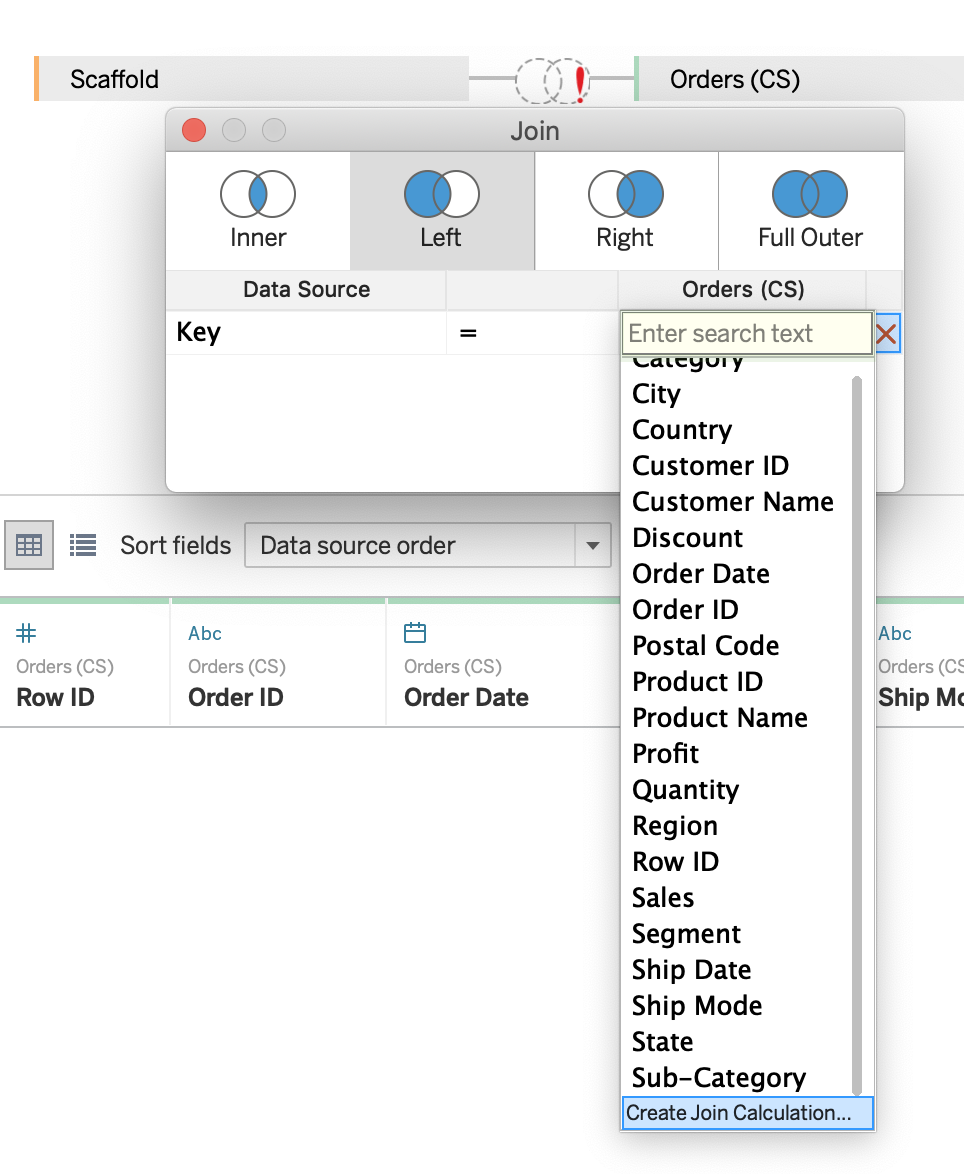
Do the same for the second ‘real’ data source, but use a join calculation of “2” as the value.
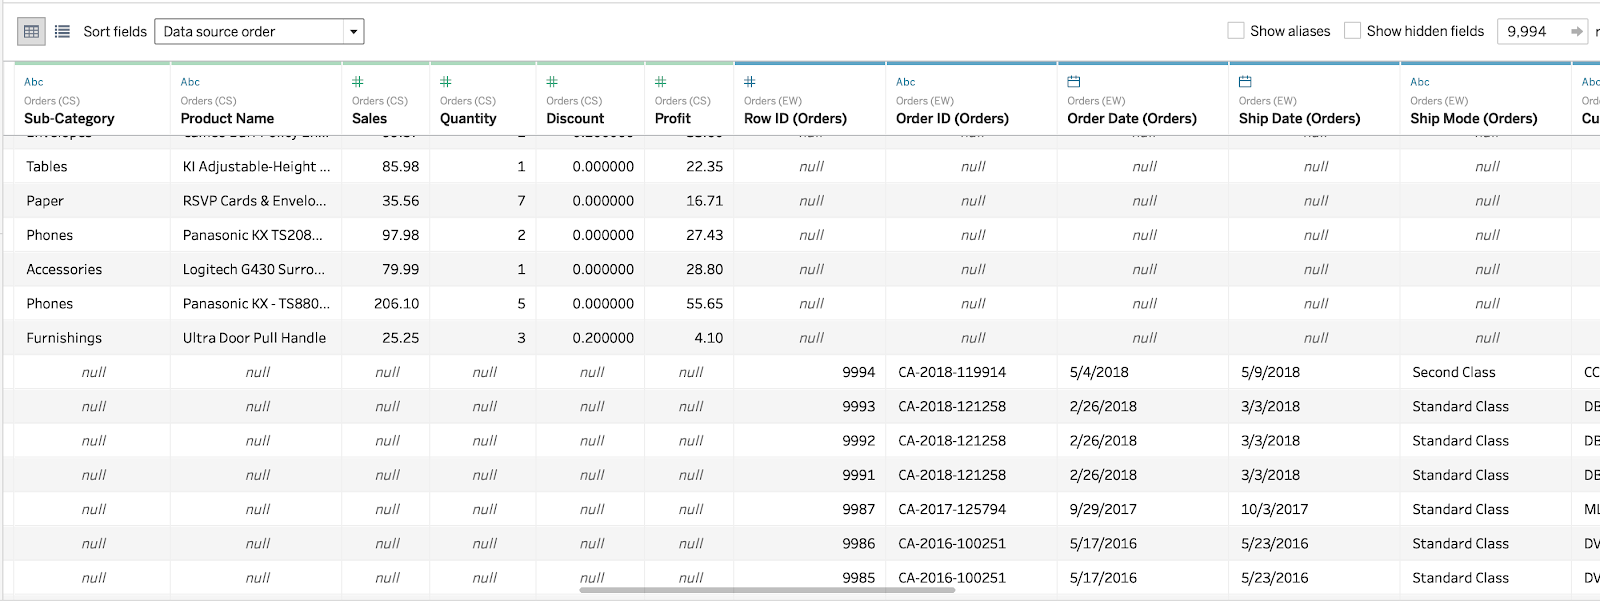
If you change the data source view to “Manage Metadata” and sort by A to Z ascending, you should notice there is one of every field from each data source. The cross join has joined our two data sources adjacent to each other.
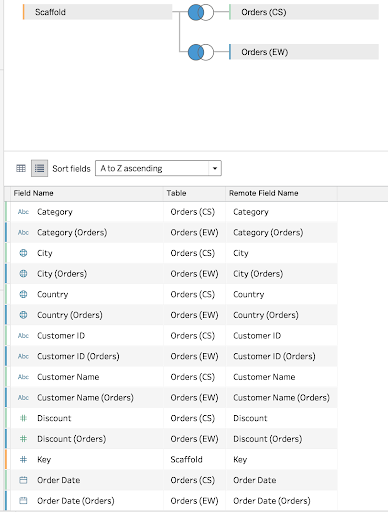
There is a null in every cell where columns from one data source join onto the other. If you show all 9994 rows in the data source and scroll down to the end of the first table you can see where the two data sources intersect. After this point, every cell in the first set of columns are null, and the second set has values.
Step 3: Create Consolidated Fields
Now we have all the data in one table, but we don’t have any columns with data from all regions. Next we create consolidated fields for our dashboard. We can do this a couple ways, but I’m only going to consolidate a few fields for this tutorial – Region, Date, and Sales.
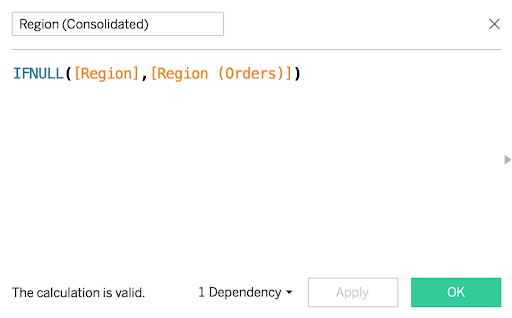
Option 1: Use IFNULL Functions
This is the simplest option and evaluates each field to check if null, and if so, uses another field. You can nest multiple IFNULLs if combining more than two data sources.
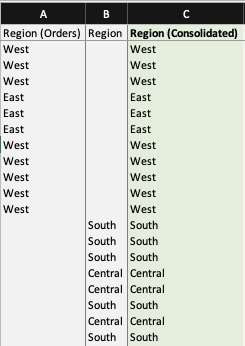
Below we can see the difference between the original region columns and the new one by displaying the number of records. The original fields only have values from their own data sets.

We can also export the data to see how this looks inside the data source.
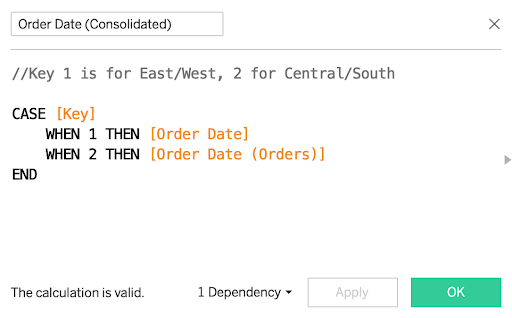
Option 2: Use a Case Statement
This option is heavier on syntax, but if you have multiple data sources and varied column names it helps keep track of which columns you use in each consolidated field. I also use this method with the ‘Table Name’ field to align columns in a traditional join, but here we must use the Key field. The CASE statement evaluates the Key field,using a specific column when a certain value evaluates as TRUE.
Option 3: Use ZN (Zero Null) function
This option is simpler than the Case statement, but can only be used for measures since it is mathematical. It doesn’t require the nesting of an IFNULL, making it an easy way to consolidate measures. The ZN function simply adds columns together at the row level and replaces NULL values with 0.

After consolidating all the fields, we drag them onto a worksheet to verify they’re working as intended.
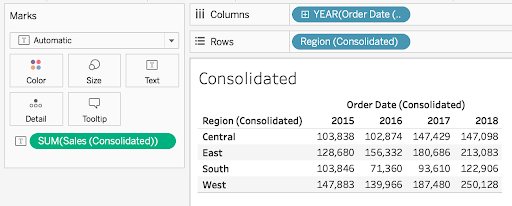
There we go! We have successfully unioned data from two different databases.
Additional Considerations and Tips
Cross-database unions aren’t pretty, but they get the job done. Keep in mind that your data sets have a lot of columns, then you must create a lot of calculated fields, potentially impacting performance.
I also like to create naming conventions and acronyms for my fields to easily swap them in and out of calculations. The ‘Organize by Folder’ option is a great way to store fields in an orderly manner.
If you union tables within your data sources and then join like I did, you’ll also need to follow a very specific order or Tableau will throw an error. You must create all joins first, and then go back and union within your established data sources. I unfortunately found this out the hard way, but hopefully you won’t with this guidance.
The ‘scaffolding’ technique can also help create a continuous date field or axis if your original data source doesn’t have one. Imagine you only had start and end dates for an event, but wanted to distribute a measure across those dates.
I’ve run into this challenge creating resource planning dashboards where the project manager wants to apply a man-hour curve to a project timeline. To accomplish this, you need a row for every day you want to visualize, so you would join into a date dimension or scaffold table. Look out for a future blog post covering this topic.
I hope this tutorial helps you solve your own challenges bringing multiple database into Tableau.
Completed Workbook on Tableau Public
Written By

Jay Farias
Data Visualization Manager Jay Farias is a technology enthusiast who specializes in Tableau. He has years of experience implementing innovative technology solutions in the construction and healthcare industries. He supports Data Visualization strategy and implementation for Kantar Health and Intuit.