The third thing we wish we knew the first day we used Tableau is that when we connect to data, the software will classify each field as a dimension or a measure. Tableau will then group the fields by their dimension or measure classification on the left-hand side of the workspace.
Having a good understanding of the differences between dimensions and measures makes it much easier to work with the data in Tableau.
What is a measure?
According to Tableau’s Knowledge Base, a measure is a field that is a dependent variable; that is, its value is a function of one or more dimensions.
Tableau treats any field containing numeric (quantitative) information as a measure.
Consider the following bar chart, created in Tableau with the Sales measure from the Sample – Superstore data set:
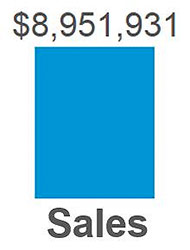
Sales is quantitative, so by default, Tableau will guess that the field is a measure. It can be considered a dependent variable, because a measure by itself does not provide much value.
The value of $8,951,931 is meaningless by itself. It is dependent on context that comes in the form of being broken down by dimensions.
What is a dimension?
According to Tableau’s Knowledge Base, a dimension is a field that can be considered an independent variable. By default, Tableau treats any field containing qualitative, categorical information as a dimension.
Here is the same Sales measure from above, broken down by the dimension of Region:
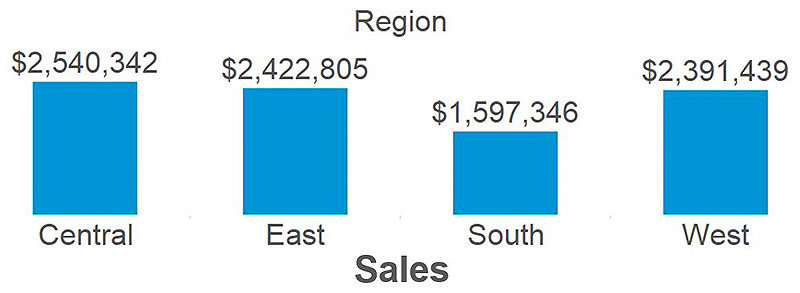
Now that our sales total has been broken down by region, we are able to start gaining insights from the data.
One insight that emerges is that the South region has relatively low sales compared to the other regions.
This is a descriptive insight that materialized only when we combined measures and dimensions together.
Generally, the measure is the number; the dimension is what you “slice and dice” the number by.
That being said, there can be exceptions to this rule, so it helps to understand how Tableau treats these types of fields.
Consider a business that has unique numerical order IDs for each sale (i.e. Order 1 is assigned the number 1, order 2 is assigned the number 2, and so on).
Looking at the definition above, Tableau will classify this Order ID field as a measure the first time you connect to a data set containing the field. However, Order ID is a dimension because we would ‘slice and dice’ a measure, such as Sales, by Order ID to see how much revenue we brought in per order.
Another rule of thumb we follow is that if it doesn’t make sense to sum up a number, it is likely a dimension.
That’s the case with the hypothetical Order ID field just mentioned. There would never be any value in adding up all of our Order ID numbers to get the total, and sure enough, this field should be a dimension instead of a measure.
One more case that comes to mind where Tableau can misclassify fields is when you have a field that should be a measure, that has the word NULL in the first entry under the column header in your data. The word NULL would be seen as a string value to Tableau, and thus qualitative, which would cause Tableau to classify the field as a dimension.
The good news is that any field that is misclassified can easily be reclassified by right-clicking on the field from within the Dimensions Shelf or Measures Shelf and choosing “Convert to dimension” or “Convert to measure” as appropriate.
The same thing can be achieved by dragging and dropping the field into the Dimensions Shelf or Measures Shelf.
An understanding of how dimensions and measures work in Tableau, combined with the basic data preparation just mentioned (when applicable), will make it easier to create visualizations moving forward.
Written By

Evolytics
This post is curated content from the Evolytics staff, bringing you the most interesting news in data and analysis from around the web. The Evolytics staff has proven experience and expertise in analytics strategy, tagging implementation, data engineering, and data visualization.