
One of the most panic-inducing visuals in data visualization is a line graph that has a sudden, and steep, decline. When there is truly an issue with the business that needs to be addressed, it is important to share the illustrated insight with stakeholders that can take action.
However, an apparent steep drop on a line graph can also be caused when time periods are not the same number of days, as is the case when a week, month, or year starts over (i.e. one day in the current week vs. seven days in the prior week).
When the latter scenario happens, it can lead to misinterpreted findings and unnecessary panic; both of which you want to avoid in data visualization. Misinterpretations can lead to the wrong actions and unnecessary panic is a distraction from finding the real stories in the data.
This post shares a technique for filtering out partial time periods in an analysis.
Real Life Example
To help illustrate when it helps to filter out partial time periods in Tableau, let’s first take a look at a view that often shows up in real life. Using the Sample – Superstore data set, we’ll say we’re looking at an annual report for the year 2014 with data through December 6th.
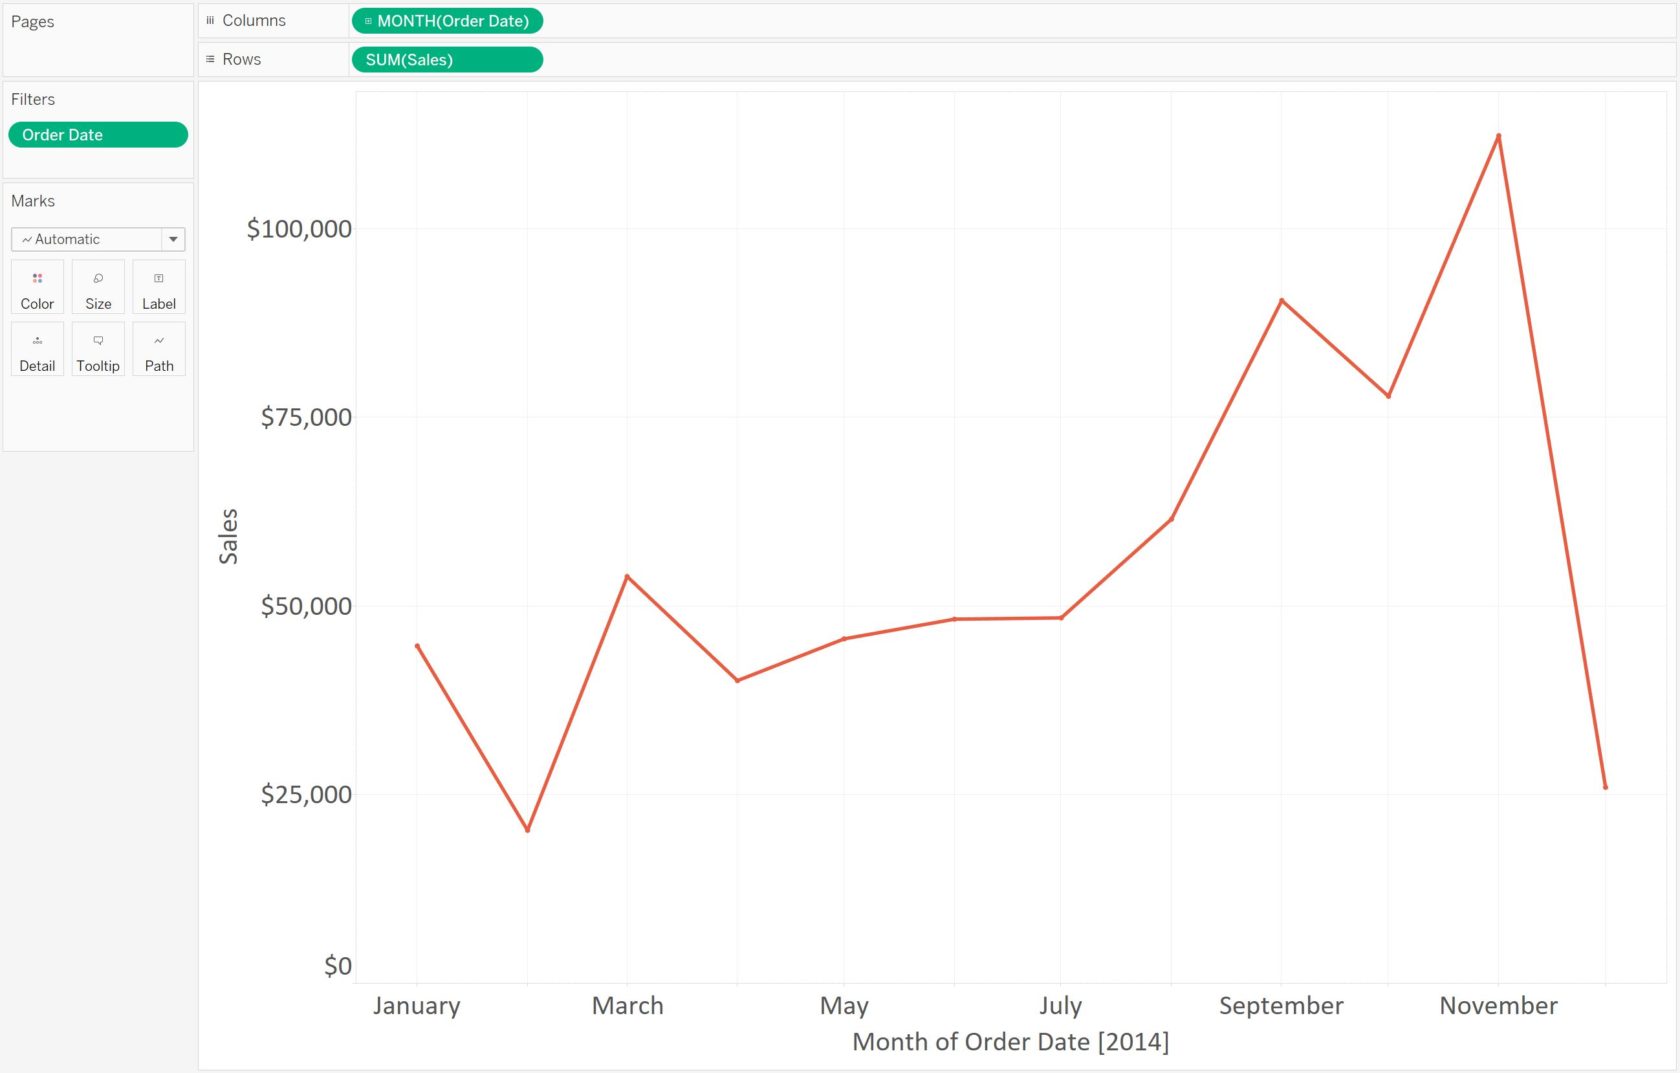
By the looks of this graph, after a brief downturn in February, the business recovered and has been steadily trending upward. That is until December, when we see sales plummet again to near the low-point for the year. There is nothing on this graph that indicates December is not yet complete. If we are looking at this graph on December 7th, we likely will understand why December is not complete, but there are other reasons that may cause the December view to not be ready to share. The data may take time to collect, process, and update for example.
Fixing with a Calculated Field
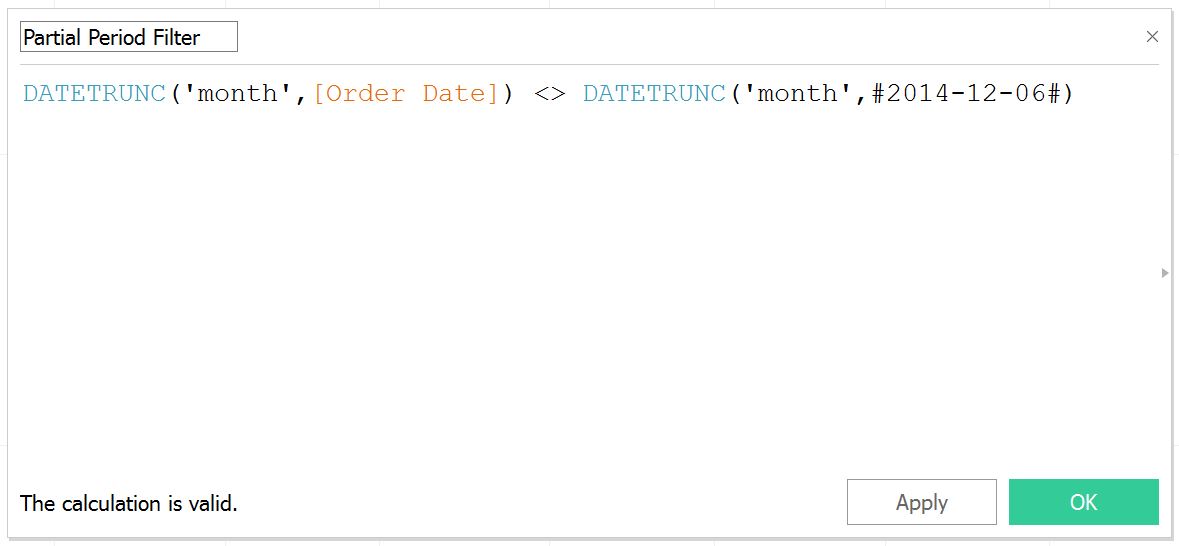
If you are in a similar situation and want to filter incomplete time periods out of the view, build a calculated field with this formula (use your own date dimension in place of Order Date):
DATETRUNC(‘month’,[Order Date]) <> DATETRUNC(‘month’,TODAY())
This calculation is telling Tableau whether or not the first day of the Order Date’s time period matches the first day of today’s time period. Today will always be part of an incomplete time period, so if we want to filter out partial time periods, we would keep only the Order Dates that don’t match today’s time period. This is a Boolean formula meaning it’s either true or false; in this case, we want to keep only the ‘True’ results.
To show how this works using the Sample – Superstore data set, I have replaced ‘TODAY()’ with the hard-coded date #2014-12-06#:
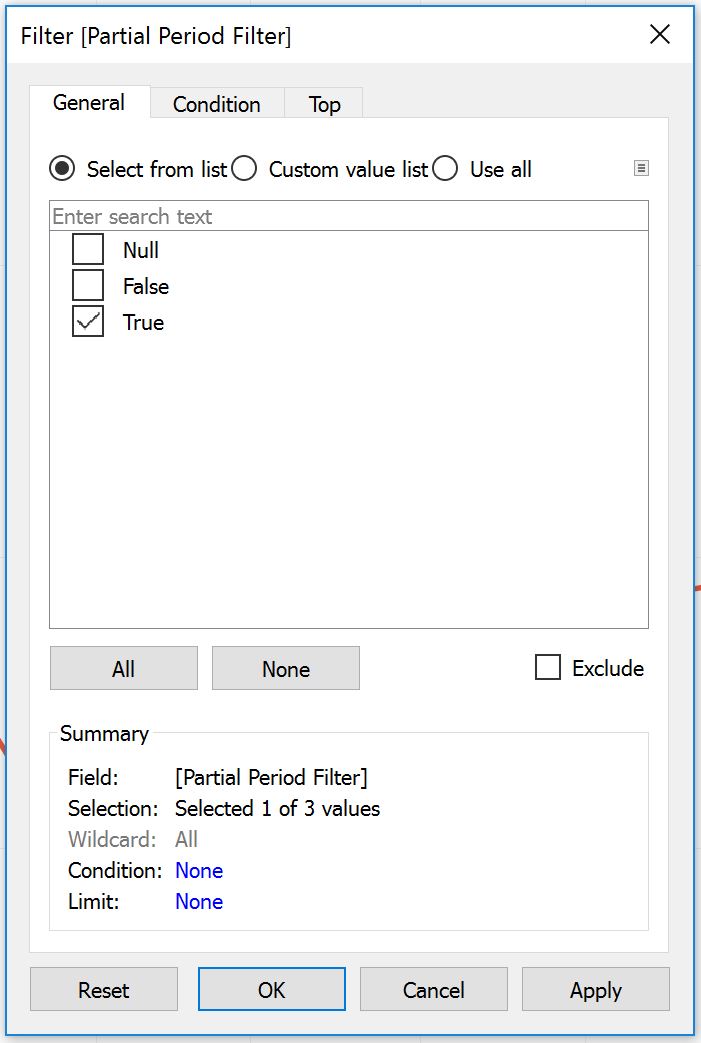
Once we have this calculated field, we will drag it to the Filters Shelf and choose “True”:
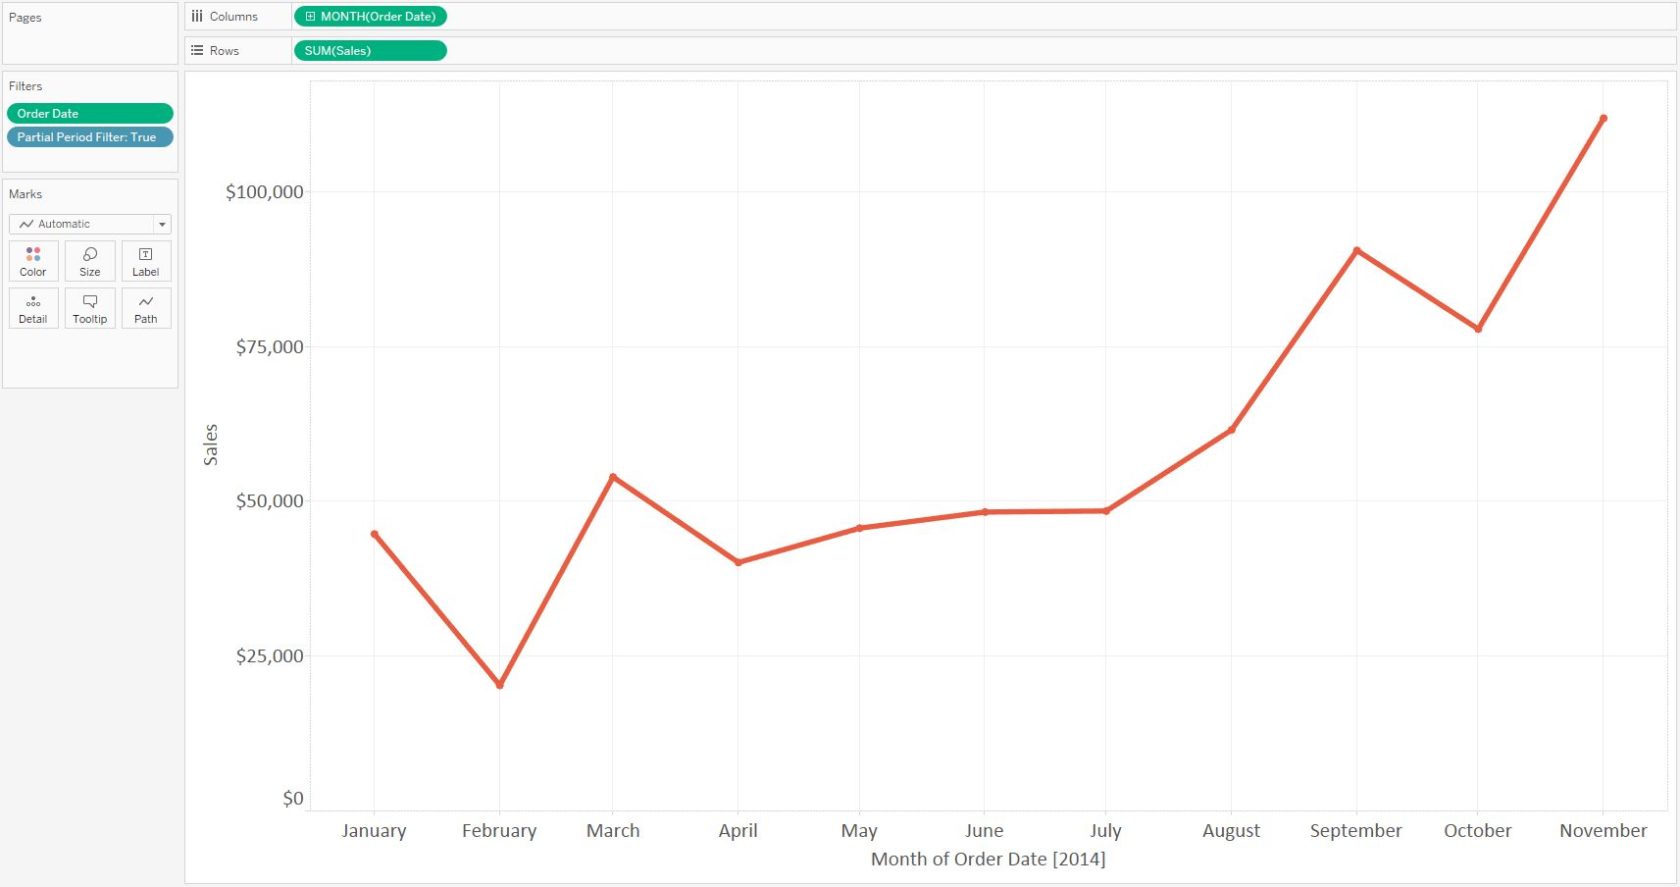
And after applying the filter – the partial time period disappears from the view, and holiday-happiness and visions of year-end bonuses are restored!
Making Dynamic
This technique can be combined with our trick for changing the date granularity of a line graph so that the partial period filter works whether you are looking at weeks, months, quarters, or years. If you are using a parameter to change the date granularity from day, to week, to quarter, etc., just replace the ‘month’ granularity in the formula above with the parameter. The formula would look something like this:
DATETRUNC([Date Granularity Parameter],[Order Date]) <> DATETRUNC([Date Granularity Parameter],TODAY())
As long as the values in the parameter are lowercase, the partial period filter will dynamically filter out the incomplete period as you choose different aggregations, whether it be the most-recent incomplete week, quarter, month, or year.
Written By

Evolytics
This post is curated content from the Evolytics staff, bringing you the most interesting news in data and analysis from around the web. The Evolytics staff has proven experience and expertise in analytics strategy, tagging implementation, data engineering, and data visualization.