
Problem: Tableau makes selecting and changing the aggregation of a date dimension very easy while you are building a view. However, unless an end user is viewing an individual sheet in Tableau Desktop, they can’t easily pivot the date granularity between day, week, month, quarter, and/or year on their own.
Solution: Create a parameter that includes each date granularity option you want your end users to have access to (i.e. Day, Week, etc.), and create a calculated field that will act as your aggregation-changeable date.
In many cases, it makes sense to change the granularity of a line graph over time.
Take the Sample Superstore data that comes packaged with Tableau, for example. The dataset includes four years of daily data.
If you are trying to view your sales over time and you set the date aggregation to year, you are provided a 10,000 foot view of your sales trend, but no seasonal insight.
On the other hand, set the date granularity to a continuous day, and while outliers stand out, it is nearly impossible to differentiate between individual days because you are looking at 1,427 marks at the same time.
As you can see, viewing your sales over time at different levels of date granularity will tell very different stories.
Why permanently choose the date aggregation of your view when you can allow your end users to choose for themselves?
How to Change Date Aggregation Using Parameters
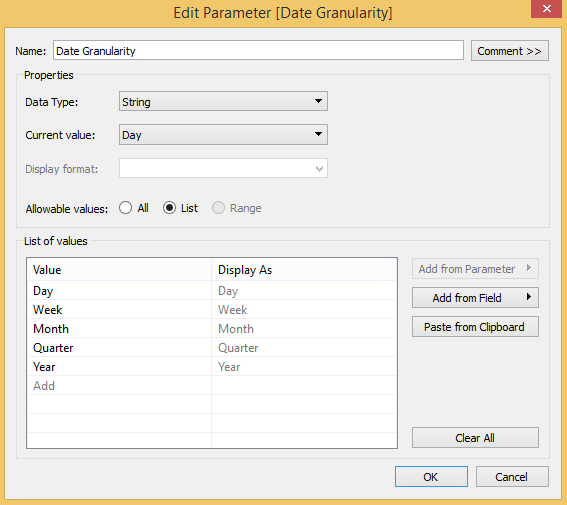
Step 1: Create a string-based parameter with each level of date aggregation, as follows:
Step 2: Create a calculated field, leveraging the DATETRUNC function to change the date aggregation to the appropriate level based on which parameter option is selected.
Here is the logic:
CASE [Parameters].[Date Granularity]
WHEN “Day” THEN [Order Date]
WHEN “Week” THEN DATETRUNC(‘week’,[Order Date])
WHEN “Month” THEN DATETRUNC(‘month’,[Order Date])
WHEN “Quarter” THEN DATETRUNC(‘quarter’,[Order Date])
WHEN “Year” THEN DATETRUNC(‘year’,[Order Date])
END
Step 3: Instead of Order Date, use your newly created Date Granularity field.
For best results, add the date field to the columns shelf by right-clicking and dragging; then choose the first option (Continuous).
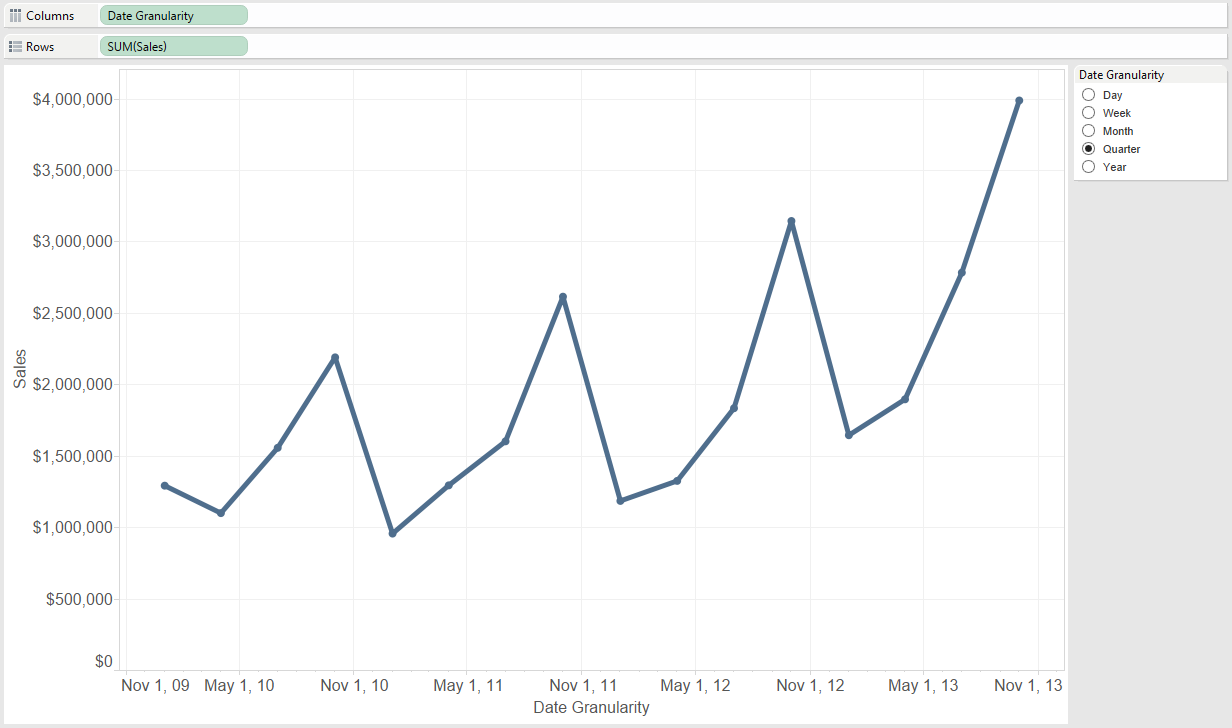
Step 4: Ensure you right-click on the Date Granularity parameter and choose “Show Parameter Control” so your end users can choose their level of date aggregation.
Your final product will look like this:
Written By

Evolytics
This post is curated content from the Evolytics staff, bringing you the most interesting news in data and analysis from around the web. The Evolytics staff has proven experience and expertise in analytics strategy, tagging implementation, data engineering, and data visualization.