The central theme of our data visualization practice at Evolytics is that “the key to making sense of data is visualization.” We feel that has never been truer than when trying to interpret the traffic by intersection data that this viz was built from. Without the ability to plot each intersection by its latitude and longitude coordinates, it is difficult to gain the same insight that is provided by the spatial context.
The data viz can be used to answer questions such as:
- What is the best way to navigate downtown?
- Can I expect delays at certain turns?
- Should I try taking a different street to work?
- Where do I need to be extra aware of pedestrians?
To use this interactive visualization, hover over a Kansas City, Missouri intersection in the map to update the vehicle and pedestrian traffic volume data for that specific intersection. You can explore the city by using the zoom controls that appear in the top left corner when hovering over the map. Detailed instructions appear when hovering over the “i” icon in the top left corner of the viz.
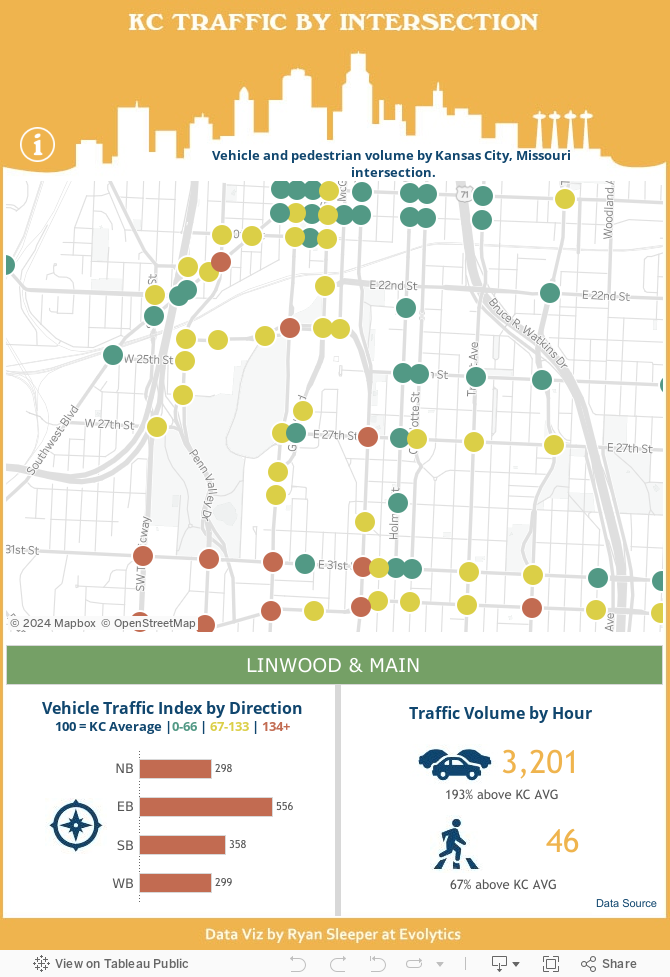
To communicate the vehicle volume per hour in the map and the vehicles per hour by direction in the bar chart below the map, this viz makes use of a 100 point index. An index of 100 means that the data matches the average for all of Kansas City, Missouri. Scores below 100 are under the Kansas City average, which in this case, is good. Scores above 100 are above the Kansas City average, which in this case, is bad. Green represents scores from 0-66, yellow from 67 – 133, and red from 134+.
This viz was built from an Open Data file from Kansas City, Missouri.
The Kansas City Traffic by Intersection viz is the second in a series designed by Tableau experts at Evolytics, one of the leading digital analytics consulting firms in the United States. To view the first post, visit Cost of Living in the United States.
Written By

Evolytics
This post is curated content from the Evolytics staff, bringing you the most interesting news in data and analysis from around the web. The Evolytics staff has proven experience and expertise in analytics strategy, tagging implementation, data engineering, and data visualization.