
Evolytics’ Director of Data Visualization, Ryan Sleeper, has been selected as the winner of Tableau Public’s Visualization of the Year for his viz, The Cost of Attending the 2015 World Series. Each year since 2013, employees of Tableau have handpicked their favorite 25 visualizations of the year from thousands of published visualizations. The 25 finalists then go to a popular vote among all of Tableau’s online community to choose the top 5.
This is Ryan’s third time in three years as a Top 25 finalist, second as a Top 5 honoree, and first as recipient of Tableau Public Visualization of the Year.
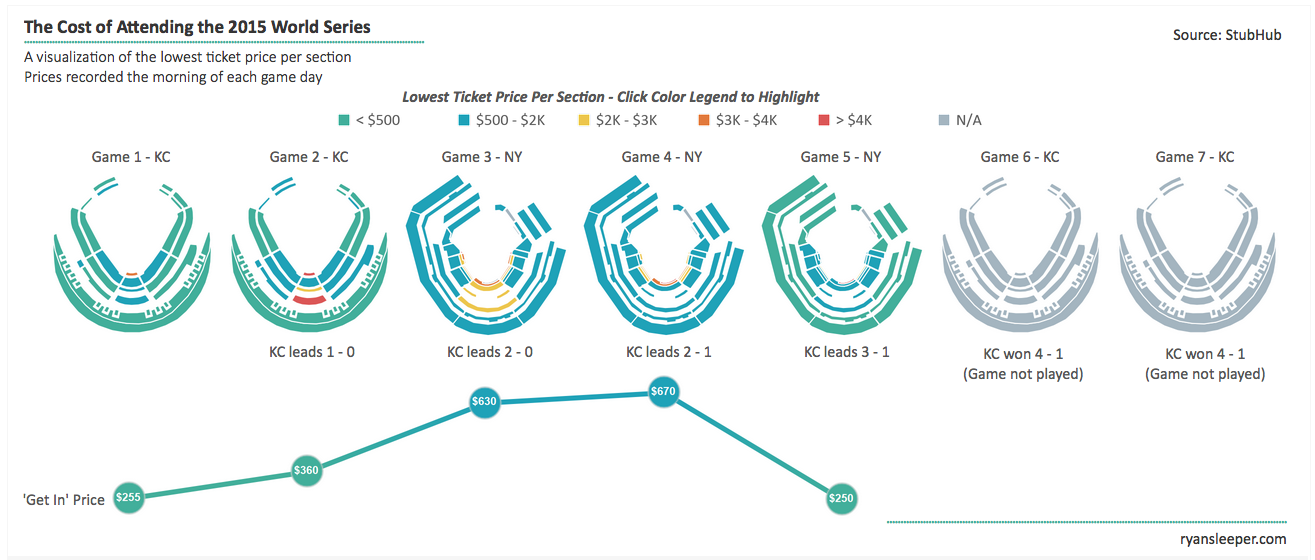
Here is a look at the winning visualization.
The Cost of Attending the 2015 World Series
[Click to see interactive version]
In 2015, Tableau Public passed the 150,000 active users milestone, and Tableau Public’s Director of Product Marketing, Ben Jones, reported that Ryan’s viz was voted #1 among over 80,000 visualizations posted to Tableau Public in 2015:
Over 80K data visualizations were saved to @tableaupublic in 2015. @OSMGuy‘s was voted #1 https://t.co/reqpGOtZwK pic.twitter.com/JNvUdiUd4X
— Ben Jones (@DataRemixed) January 4, 2016
“It is an amazing honor to be recognized among so many talented authors in the Tableau Public community. The top 25 Tableau Public vizzes get better each and every year, and it means a lot to me personally that the community continues to enjoy my work,” said Ryan.
We are proud of Ryan for earning this achievement that he can add to his 2013 Tableau Iron Viz Championship, and look forward to seeing what’s next in 2016!
Written By

Carey Wilkins
As President of Evolytics, Carey Wilkins provides strategic leadership across Evolytics operations, ensuring continued growth of existing client partnerships and new business efforts. With over 20 years of interactive marketing and digital analytics experience, Carey speaks at digital analytics conferences worldwide and has been pivotal in growing the footprint of Evolytics to include analytics support for some of the world's most recognized and respected brands.