Using Excel to Interpret your A/B Test Results
This is part two in a series. If you haven’t read part one about developing an A/B Test, click here.
Many A/B Tests are set up to measure the difference of proportions, meaning your KPI is based on the percent of users in each sample who do something. If you’re using a popular testing tool such as Optimizely, Adobe Target, Google Optimize, VWO or Split IO, the tools will do this math for you quite easily.
Some tools fall short on calculating the difference of means, say, if you want to compare revenue per visitor for each recipe.
Of course, if you plan to do this at scale, I recommend using a Python script, but if you don’t have a data scientist or data engineer handy, and you have less than a million rows of data, Excel can get the job done in a pinch.
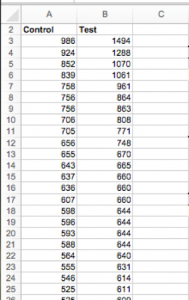
You’ll want to export two columns, one for each of your recipes. The rows should be your KPI, we’ll stick with revenue per visitor.
Now that you have your data, you will export it into two Excel columns: Test and Control.
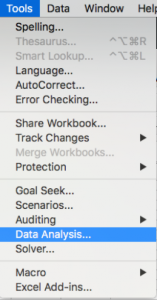
To perform statistical analysis in Excel, you’ll want to install the Analysis Toolpak. To begin using it, click Tools from the drop down menu and then Data Analysis.
Do you perform a T-Test or a Z-Test?
Next you will need to choose your test: Z-test or T-test? T-tests are used most commonly outside of the classroom because they are safe with low sample sizes and unknown standard deviations. For this analysis, we are going to use the T-test.
You will notice that the Analysis Toolpak has numerous versions, so which T-test do you choose?
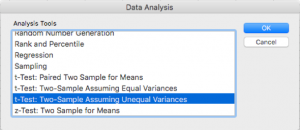
Because this data is, in fact, two separate samples that are independent of one another, it is safe to use the two-sample T-test. As a note, paired samples generally mean that they are somehow related or dependent upon one another. A pre/post test would use the Paired-T.
So, we know we are using the two-sample T-test. However, we’re not sure if we should use equal or unequal variances.
Use the F-Test to measure variance
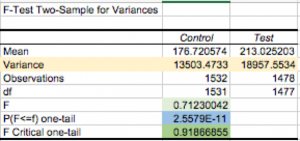
Perform your F-test, making Control the first variable range and Test the second. Results should look like the output to the left.
Highlighted in yellow, you can see the variance for each sample. They are obviously different, but are they statistically different?
To interpret this, you will want to pay attention to the F Critical one-tail value, which is highlighted in darker green. If your F value (highlighted in light green) is less than the F Critical value, your variances are statistically unequal. You can also check the p-value, which is essentially the probability that the results are random chance. The p-value, highlighted in blue, shows that there is actually a really low chance (almost zero chance) that the difference in the variance is due to random chance.
Now we know to perform a Two-sample T-test with Unequal Variances.
How to interpret the T-Test results
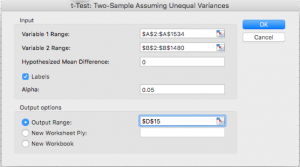
To conduct a two-tailed test to see if there is any difference, highlight the variable ranges in either order. For a T-test, having the same sample size is not necessary, as shown here.
Enter 0 for the hypothesized mean difference. You can adjust alpha to be more or less stringent, but .05 is generally accepted as statistically significant.
Alpha is essentially the chance you are willing to take that your results are incorrect. With a .05 alpha, you are 95% confident in your results.
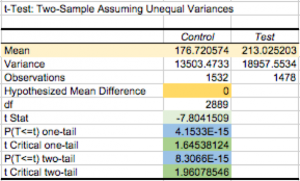
The results shown here showcase the difference in means, highlighted in pale yellow. If you are reading a table, you will want to know how the t-stat compares to the t-critical, but an advantage of Excel is that it gives you a p-value. The p-value is the probability that your null hypothesis is true. In this case, there is less than a 1% chance that A = B.
An example of a difference of means test

Let’s create a hypothesis to test: If we reduce steps in the conversion funnel, then we will see revenue per unique visitor increase by at least $25.
- H0: B – A ≤ 25
- H1: B – A > 25
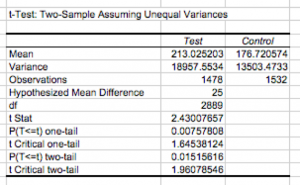
Make the Variable 1 Range Test and the Variable 2 Range Control Pay close attention to which range you’re putting in which order because Excel always does Variable 1 – Variable 2 and does not allow you to use negative numbers in the hypothesized difference.
As you can see, the p-value for the one-tail test is .007 or .7%. Since this is much lower than 5%, or .05, one can conclude that the difference between A and B is greater than $25.
If these were the results of your A/B testing experiment, you could conclude that the Test mix is a success.
Written By

Krissy Tripp
Krissy Tripp, Director of Decision Science, strives to empower her clients to make use of their data, drawing from a variety of disciplines: experimentation, data science, consumer psychology, and behavioral economics. She has supported analytic initiatives for brands such as Sephora, Intuit, and Vail Resorts.